Exercise 9.1
Using data from Table , plot the demand and supply curve at the three prices, i.e., ₹, ₹, and ₹150. Identify and mark excess demand and supply on the graph. Think about how equilibrium could be reached in these scenarios.
The book prints no answer for this
NCERT publishes no answers for this textbook, so there is nothing in the book to check this working against. It has also not yet been read through by hand.
Plot price on the y-axis (₹$\displaystyle 40$, ₹$\displaystyle 100$, ₹$\displaystyle 150$) and quantity on the x-axis ($\displaystyle 0$ to about $\displaystyle 45$ kg).
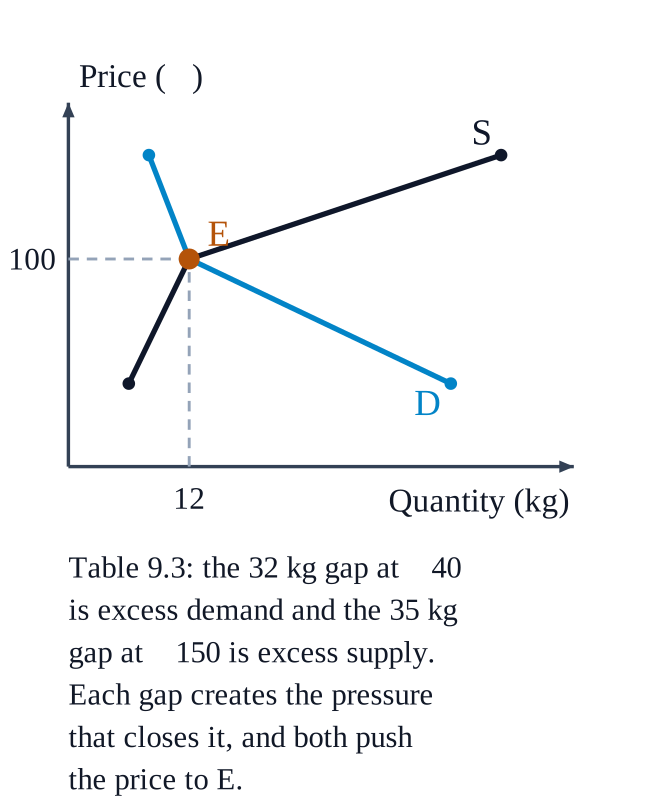 The two curves
Demand points from Table $\displaystyle 9.3$: ($\displaystyle 38$ kg, ₹$\displaystyle 40$), ($\displaystyle 12$ kg, ₹$\displaystyle 100$), ($\displaystyle 8$ kg, ₹$\displaystyle 150$). Joined, they give a downward-sloping demand curve.
Supply points: ($\displaystyle 6$ kg, ₹$\displaystyle 40$), ($\displaystyle 12$ kg, ₹$\displaystyle 100$), ($\displaystyle 43$ kg, ₹$\displaystyle 150$). Joined, they give an upward-sloping supply curve.
The two cross at ₹$\displaystyle 100$ and $\displaystyle 12$ kg — mark this point E, the market equilibrium.
Marking the gaps
At ₹$\displaystyle 40$, draw a horizontal line from the supply curve ($\displaystyle 6$ kg) across to the demand curve ($\displaystyle 38$ kg). That gap of $\displaystyle 32$ kg is excess demand.
At ₹$\displaystyle 150$, draw a horizontal line from the demand curve ($\displaystyle 8$ kg) across to the supply curve ($\displaystyle 43$ kg). That gap of $\displaystyle 35$ kg is excess supply.
How equilibrium is reached
At ₹$\displaystyle 40$ far more mangoes are wanted than are offered. Buyers compete, some are willing to pay more, sellers see they can charge more — the price is bid up towards ₹$\displaystyle 100$, which trims quantity demanded and draws out more supply.
At ₹$\displaystyle 150$ sellers are left with unsold mangoes. To clear a good that will not keep, they cut the price towards ₹$\displaystyle 100$, which brings buyers back and discourages some supply.
Each gap creates exactly the pressure that closes it, and both arrows point to E.