SolveItClass 9 · NCERT

NCERT Solutions · Class 9 Social Science The Price Puzzle: What Drives the Market

24 questions · 24 still being checked

Questions and activities 9.1–9.12 (part 6 of 6)

  1. Exercise 9.1

    An increase in income always leads to a rise in demand for goods. Defend or refute, giving reasons for the same.

    The book prints no answer for this

    NCERT publishes no answers for this textbook, so there is nothing in the book to check this working against. It has also not yet been read through by hand.

    Refute the statement. A rise in income usually raises demand, but not always — the word 'always' is what makes it wrong.
    NCERT_Solution_Class9_SocialScience_Ch9_QA_Q9-1
    The chapter itself is careful: when income rises, consumers can afford more, and demand for several goods rises. Several is not all.
    Income only supplies purchasing power, which is half of demand. Demand is willingness and ability. A richer person still will not buy what they do not want.
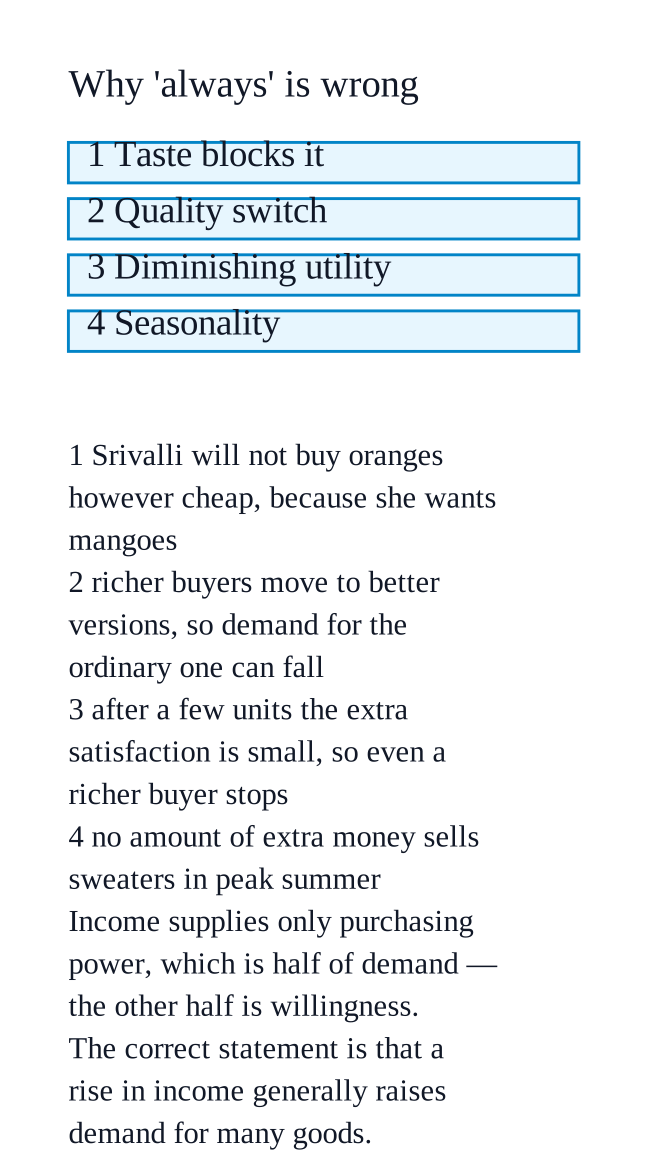
    Taste and preference can block it — Srivalli will not buy oranges however cheap they are, because she wants mangoes; more income does not change that.
    With more income people often switch to higher-quality products, so demand for the ordinary version they used to buy can actually fall.
    Diminishing marginal utility limits it as well: after a few units the extra satisfaction is small, so a richer buyer still stops buying more.
    Seasonality overrides income too — no amount of extra money sells sweaters in peak summer.
    Conclusion: the correct statement is that a rise in income generally raises demand for many goods, other things remaining the same.
  2. Exercise 9.2

    If petrol prices double, what happens to a. Demand for diesel cars b. Demand for electric cars c. Demand for car accessories d. Demand for public transport

    The book prints no answer for this

    NCERT publishes no answers for this textbook, so there is nothing in the book to check this working against. It has also not yet been read through by hand.

    Costly petrol pushes buyers towards every substitute and away from every complement. Petrol and cars are complementary goods, so dearer petrol makes running a petrol car expensive.
    NCERT_Solution_Class9_SocialScience_Ch9_QA_Q9-2a. Demand for diesel cars
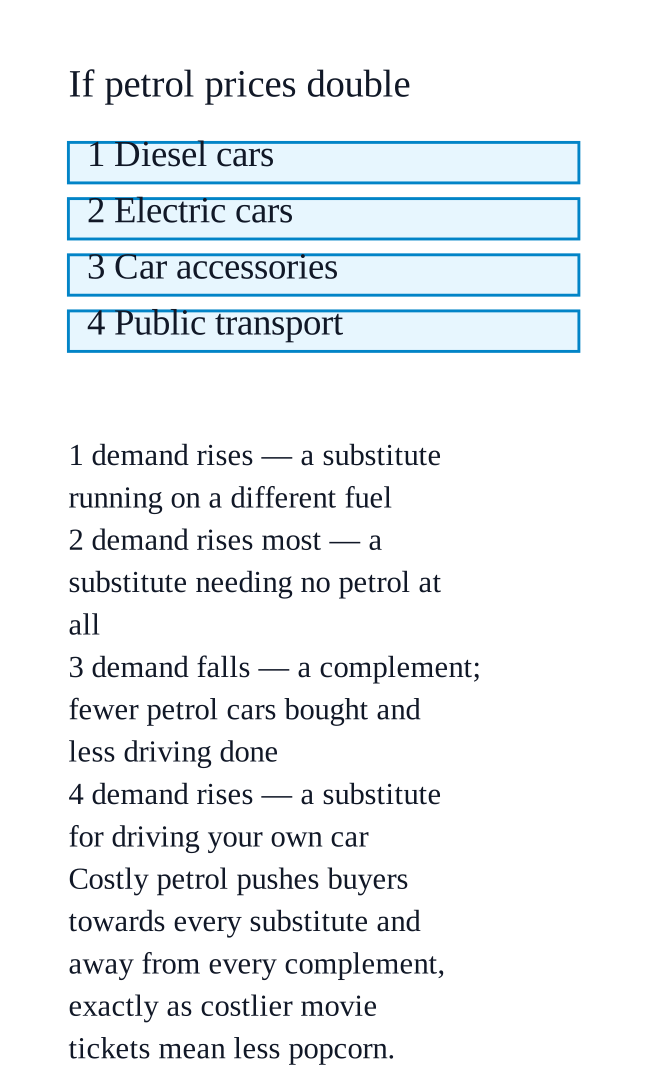
    Rises. A diesel car is a substitute for a petrol car and runs on a different fuel, so buyers switch to the cheaper option to run.
    b. Demand for electric cars
    Rises, and probably by more. An electric car is a substitute that needs no petrol at all, so doubling the petrol price makes it far more attractive.
    c. Demand for car accessories
    Falls. Accessories are complementary to owning and driving a car. With petrol cars costlier to run, fewer are bought and less driving is done, so fewer seat covers, mats and music systems are sold — the same logic as costlier movie tickets meaning less popcorn.
    d. Demand for public transport
    Rises. Buses, the metro and trains are a substitute for driving your own car, and become the cheaper way to travel.
  3. Exercise 9.3

    A farmer traditionally irrigates fields manually (labour-intensive). He installs drip irrigation (a technology upgrade) that reduces water use by 40\displaystyle 40 per cent and increases yield by 30\displaystyle 30 per cent. How does this affect a. His cost of production b. His willingness to supply at different prices c. The overall market supply if many farmers adopt this technology

    The book prints no answer for this

    NCERT publishes no answers for this textbook, so there is nothing in the book to check this working against. It has also not yet been read through by hand.

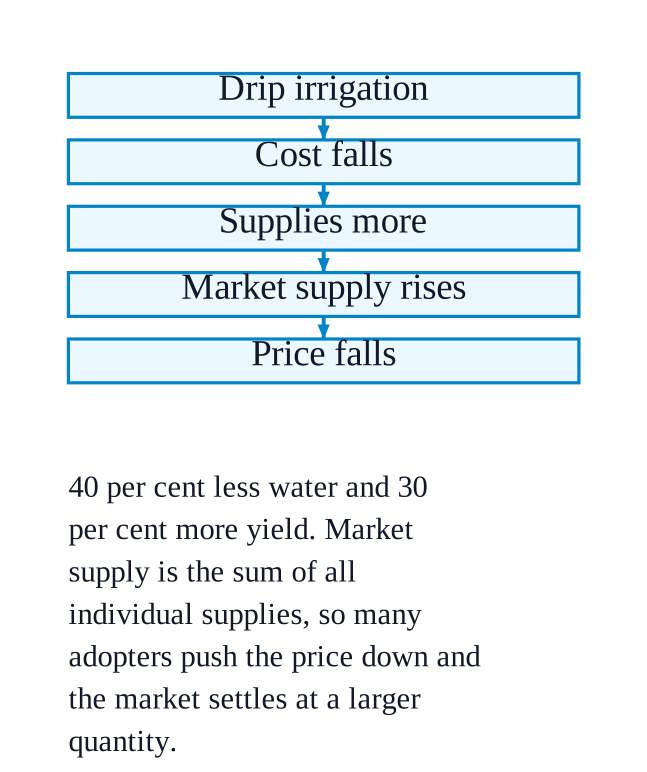
    Better technology cuts cost and raises output, so this farmer supplies more — and if many farmers do the same, so does the whole market.
    NCERT_Solution_Class9_SocialScience_Ch9_QA_Q9-3a. His cost of production
    Falls. Improvement in technology reduces the cost of production.
    He uses $\displaystyle 40$ per cent less water and harvests $\displaystyle 30$ per cent more, so the cost of producing each kilogram of crop drops on both counts.
    b. His willingness to supply at different prices
    Rises at every price. Since each unit now costs him less, the same price leaves him a bigger profit.
    His supply schedule shows a larger quantity at every price, and he is now willing to sell even at prices at which he would earlier have refused.
    c. The overall market supply if many farmers adopt it
    Market supply rises sharply, because market supply is the sum of all individual supplies.
    The chapter names drip irrigation and weather sensors as exactly the kind of improvement that raises crop production and so raises supply.
    If the rise in supply outruns demand, prices fall — buyers gain, and the market settles at a new equilibrium with a larger quantity at a lower price.
    Each farmer earns less per kilogram but sells more, and his lower cost is what keeps the change worth making.
  4. Exercise 9.4

    During online festival sales, the prices of many products are very low. Use the concept of demand and supply to explain why the sellers sell at such a low price. What happens to the equilibrium when the price is lowered? Does this benefit only consumers or sellers as well? Explain.

    The book prints no answer for this

    NCERT publishes no answers for this textbook, so there is nothing in the book to check this working against. It has also not yet been read through by hand.

    Sellers cut prices in a festival sale because a lower price sells a far larger quantity, and the extra volume earns them more than the high price would have.
    NCERT_Solution_Class9_SocialScience_Ch9_QA_Q9-4Why sellers price so low
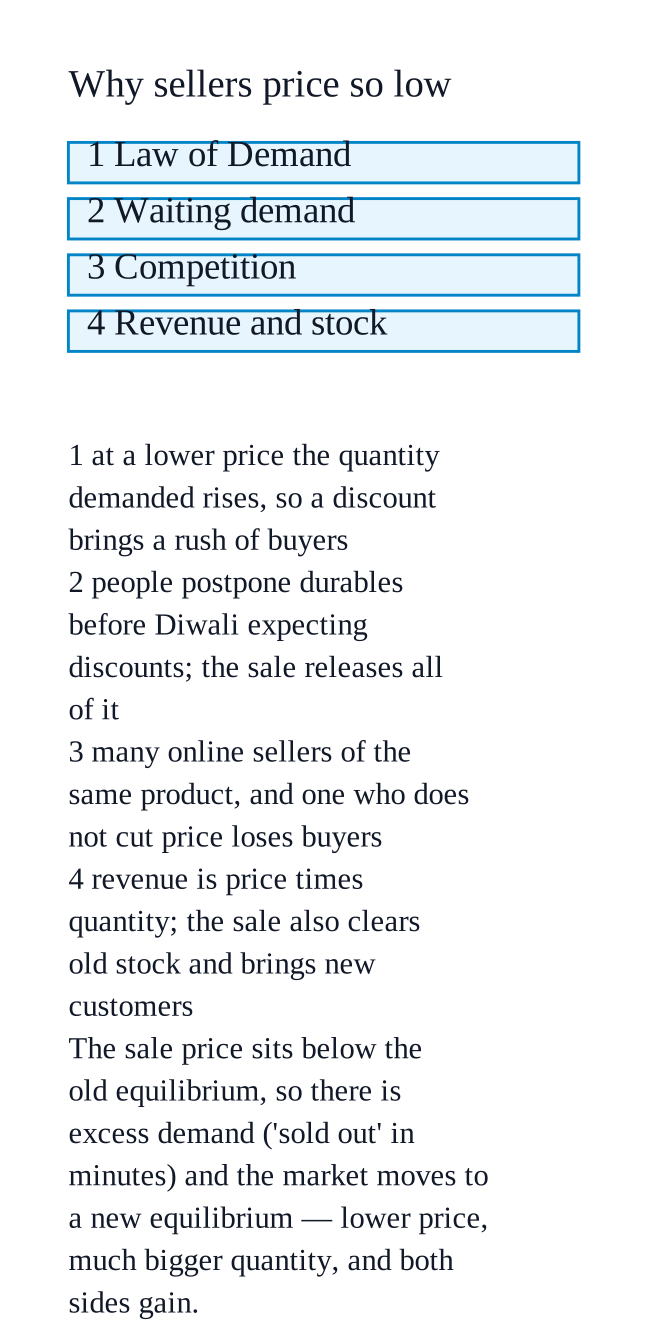
    Law of Demand — at a lower price the quantity demanded rises, so a discount brings a rush of buyers.
    Waiting demand — future price expectations make people postpone buying durables before Diwali or the New Year, expecting festival discounts. All that stored-up demand is released at the sale.
    Competition — online there are many sellers of the same product, and a seller who does not cut price loses buyers to one who does.
    Revenue and stock — revenue is price multiplied by quantity sold, so many units at a small margin can beat a few at a high margin; the sale also clears old stock and brings in new customers.
    What happens to the equilibrium
    The sale price is set below the old equilibrium price, so quantity demanded shoots past quantity supplied — excess demand, which is why popular items show 'sold out' within minutes.
    Sellers meet it by pushing out much larger quantities, so the market moves to a new equilibrium: a lower price and a much bigger quantity traded.
    When the sale ends, demand and supply return to normal and the market adjusts back — a good illustration that equilibrium is always moving.
    Who benefits
    Both sides, not consumers alone.
    Consumers pay less, their purchasing power stretches further, and some buy goods they could not otherwise have afforded.
    Sellers gain volume, higher total revenue, cleared stock, new customers and busier warehouses — and nobody forces them to discount, so they cut the price only because it pays.
  5. Exercise 9.5

    Suppose the government sets a maximum sale price for an essential vaccine below the market-driven price. What is likely to happen? Choose from the options below and elucidate your point. a. Surplus b. Shortage c. No effect d. Fall in demand

    The book prints no answer for this

    NCERT publishes no answers for this textbook, so there is nothing in the book to check this working against. It has also not yet been read through by hand.

    b. Shortage.
    NCERT_Solution_Class9_SocialScience_Ch9_QA_Q9-5Why
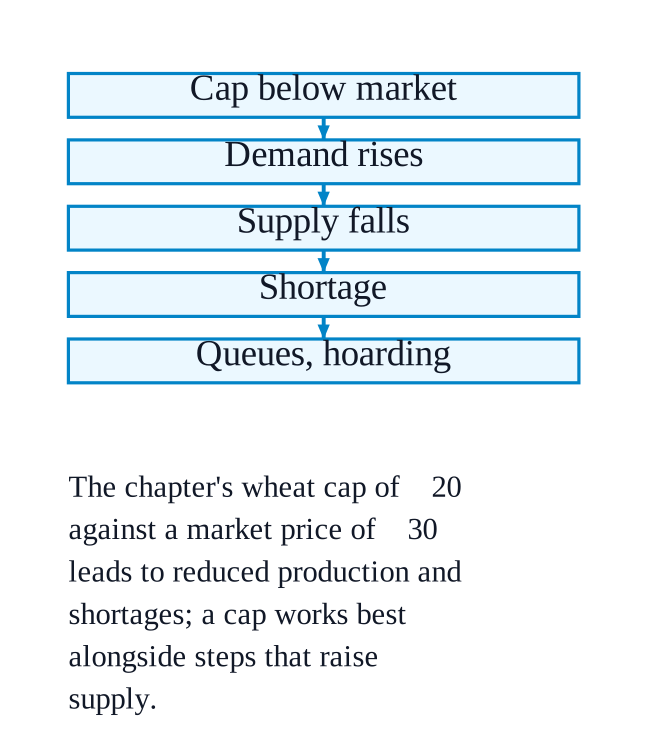
    A maximum sale price set below the market price is a price ceiling.
    At that lower price the quantity demanded rises — more people can now afford the vaccine.
    At the same time the quantity supplied falls — producers receive less than the market would pay, so their incentive drops. The chapter's own example is a maximum wheat price of ₹$\displaystyle 20$ against a market price of ₹$\displaystyle 30$, which leads to reduced production and shortages.
    Demand above supply is excess demand, exactly the ₹$\displaystyle 40$ row of Table $\displaystyle 9.3$, where $\displaystyle 38$ kg was wanted and only $\displaystyle 6$ kg offered.
    Why the other options are wrong
    a. Surplus needs quantity supplied above quantity demanded, which happens at a high price, not a low one.
    c. No effect is wrong because the fixed price is not the equilibrium price, so the market cannot clear.
    d. Fall in demand is the opposite of what a lower price does.
    What follows in practice
    Queues, waiting lists, and the risk of hoarding and black-marketing, as happened with sanitisers before the government stepped in.
    This is why a price cap works best alongside steps that raise supply — with sanitisers, many companies started production and the shortage ended.
  6. Exercise 9.6

    The government levies higher taxes on products such as tobacco and alcohol to promote healthier choices among citizens. Can you find out other goods where price controls have been set in place? What are the reasons for the same?

    The book prints no answer for this

    NCERT publishes no answers for this textbook, so there is nothing in the book to check this working against. It has also not yet been read through by hand.

    What the task asksNCERT_Solution_Class9_SocialScience_Ch9_QA_Q9-6
    Find out, from news or from your own area, other goods or services whose prices the government controls, and give the reason in each case.
    Worked example, from the chapter
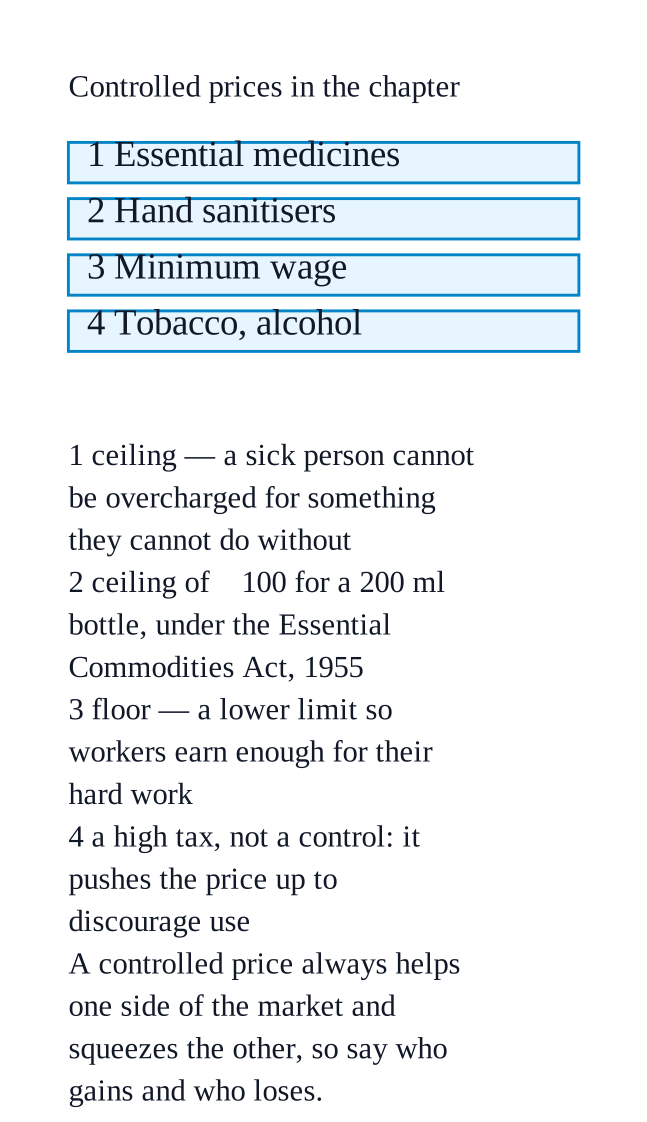
    Essential medicines — a price ceiling caps what a seller may charge, so that a sick person is not overcharged for something they cannot do without.
    Hand sanitisers during COVID-$\displaystyle 19$ — declared essential commodities under the Essential Commodities Act, $\displaystyle 1955$, with the maximum retail price capped at ₹$\displaystyle 100$ for a $\displaystyle 200$ ml bottle, because demand had surged and some shopkeepers were hoarding and black-marketing.
    Wages — the minimum wage is a price floor, a lower limit set so that workers earn enough for their hard work.
    One distinction worth making in your answer: the tobacco and alcohol case in the question is a high tax meant to discourage use, not a price control meant to protect a buyer. They work in opposite directions — a tax pushes the price up, a ceiling holds it down.
    What a good answer must contain
    Two or three named goods or services, with where you found each one.
    For each, whether the control is a ceiling (a maximum) or a floor (a minimum).
    The reason behind it — keeping essentials affordable, stopping overcharging or hoarding, guaranteeing a fair income to a seller or worker, or discouraging harmful consumption.
    One line on who gains and who loses, since a controlled price always helps one side of the market and squeezes the other.
  7. Exercise 9.7

    Can excessive government regulation hurt markets? Explain with suitable examples.

    The book prints no answer for this

    NCERT publishes no answers for this textbook, so there is nothing in the book to check this working against. It has also not yet been read through by hand.

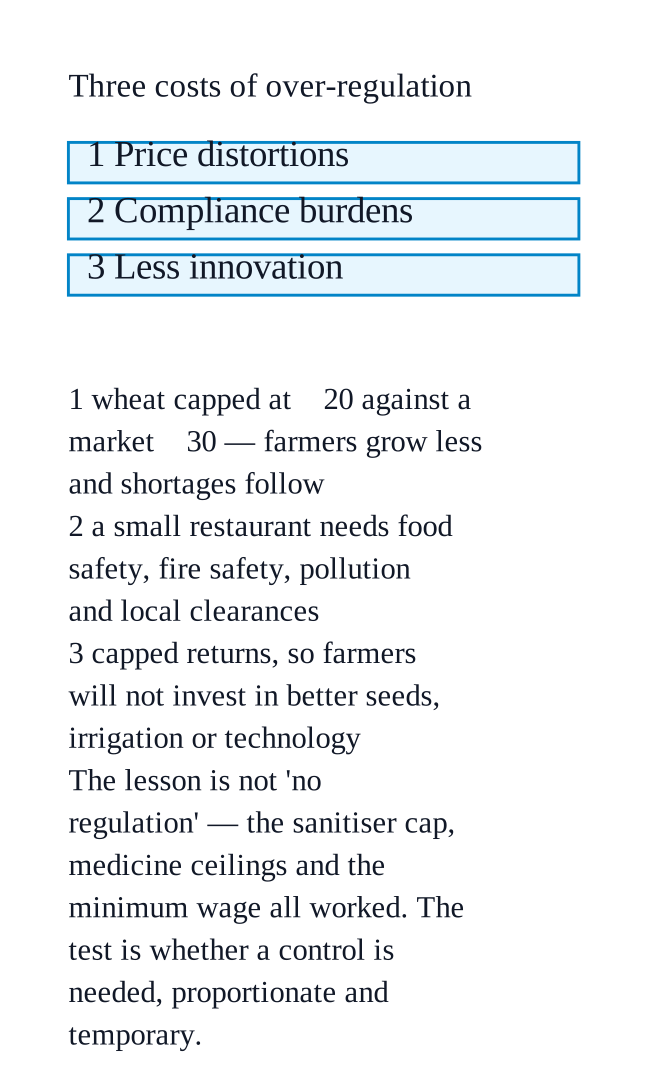
    Yes. Regulation is needed when markets are unfair or inefficient, but excessive regulation hurts markets in three ways the chapter names.
    NCERT_Solution_Class9_SocialScience_Ch9_QA_Q9-7a. Price distortions and reduced producer incentives
    Fixing a price below the market level removes the seller's reason to supply.
    The chapter's example: a maximum price of ₹$\displaystyle 20$ per kg for wheat when market forces set ₹$\displaystyle 30$ leaves farmers with less than a free market would pay. They grow less, and shortages follow.
    b. Compliance burdens
    Licences, permits, inspections and paperwork cost time and money, and hit small firms hardest. This is what ease of doing business measures.
    The chapter's example: a small restaurant needing separate clearances for food safety, fire safety, pollution control and local permissions. The cost can discourage a small entrepreneur from starting or expanding at all.
    c. Discourages innovation and entrepreneurship
    If returns are capped, nobody invests in new ideas or better technology.
    The chapter's example: farmers will not buy better seeds, irrigation or technology if they cannot earn an adequate return — so long-term productivity and output fall.
    The balance
    The lesson is not 'no regulation'. The same chapter shows regulation working: the sanitiser price cap in an emergency, price ceilings on medicines, a minimum wage, and regulators keeping monopolies in check.
    The real question is whether a control is needed, proportionate and temporary — the chapter itself asks whether emergency controls should be in place forever.
  8. Exercise 9.8

    In the table below, different prices of guava are given. a. Think and write how much guava you will buy at each price. b. Ask the same question to three of your friends and fill in the table. c. Also make a graph for each one of you and one final graph for the total quantity. Price You Friend 1\displaystyle 1 Friend 2\displaystyle 2 Friend 3\displaystyle 3 Total ₹100\displaystyle 100/kg ₹80\displaystyle 80/kg ₹50\displaystyle 50/kg ₹20\displaystyle 20/kg

    The book prints no answer for this

    NCERT publishes no answers for this textbook, so there is nothing in the book to check this working against. It has also not yet been read through by hand.

    What the task asksNCERT_Solution_Class9_SocialScience_Ch9_QA_Q9-8
    Build your own guava demand schedule, collect the same from three friends, add them into a market demand column, and draw five graphs.
    Worked example (sample figures only — yours will differ)
    PriceYouFriend $\displaystyle 1$Friend $\displaystyle 2$Friend $\displaystyle 3$Total
    ₹$\displaystyle 100$/kg$\displaystyle 0$$\displaystyle 1$$\displaystyle 0$$\displaystyle 1$$\displaystyle 2$
    ₹$\displaystyle 80$/kg$\displaystyle 1$$\displaystyle 1$$\displaystyle 1$$\displaystyle 2$$\displaystyle 5$
    ₹$\displaystyle 50$/kg$\displaystyle 2$$\displaystyle 2$$\displaystyle 2$$\displaystyle 3$$\displaystyle 9$
    ₹$\displaystyle 20$/kg$\displaystyle 4$$\displaystyle 3$$\displaystyle 4$$\displaystyle 5$$\displaystyle 16$
    The Total column is market demand — the sum of the four individual demands at that price.
    Drawing the graphs
    Put price on the y-axis and quantity on the x-axis in every graph, with the axes labelled.
    Draw four individual demand curves, one per person, and a fifth market demand curve from the Total column.
    All five should slope downwards — the Law of Demand.
    The market curve will be flatter than any individual curve, because the same price fall produces a much larger total response: in the sample, a fall from ₹$\displaystyle 100$ to ₹$\displaystyle 20$ changes your demand by $\displaystyle 4$ kg but total demand by $\displaystyle 14$ kg.
    What a good answer must contain
    Real answers from three named friends, not invented numbers.
    Quantities that never rise as the price rises.
    A Total column that is the exact sum of the four figures in its row.
    Five labelled graphs, and a sentence noting the downward slope and the flatter market curve.
  9. Exercise 9.9

    Visit the nearby vegetable market and try to find answers to the following questions. a. Who decides the prices of different vegetables in the vegetable market? b. Sometimes the prices of a few vegetables is too high, and sometimes too low. Why is this? c. The price of tomatoes is high in the morning and eventually gets lower by the evening. Have you ever noticed this? Comment.

    The book prints no answer for this

    NCERT publishes no answers for this textbook, so there is nothing in the book to check this working against. It has also not yet been read through by hand.

    What the task asksNCERT_Solution_Class9_SocialScience_Ch9_QA_Q9-9
    Visit a vegetable market, ask these three questions there, and then explain what you are told using demand and supply.
    a. Who decides the prices of different vegetables
    No single person does. The price comes out of the interaction between many buyers and many sellers.
    A seller who asks too much finds nobody buying and has to come down; one who asks too little sells out at once and raises his price next time.
    How much arrived in the market that morning, how many sellers there are, and what the shop next door is charging all feed into the figure he quotes you.
    b. Why prices are sometimes too high and sometimes too low
    Because supply changes fast for vegetables, and the chapter's rule then decides the price: when supply is less than demand prices rise, and when supply exceeds demand prices fall.
    Weather, season and disasters change how much reaches the market — a hailstorm or a flood cuts arrivals, a good harvest floods them in.
    Demand changes too — festivals, weddings and the season raise it.
    Vegetables cannot be stored long, so a glut has to be sold immediately at a low price, and a shortfall cannot be made up from stock.
    More sellers in the market means more supply and lower prices; fewer sellers means the opposite.
    c. Tomatoes cheaper by evening
    Yes, and it is a straightforward demand-and-supply story.
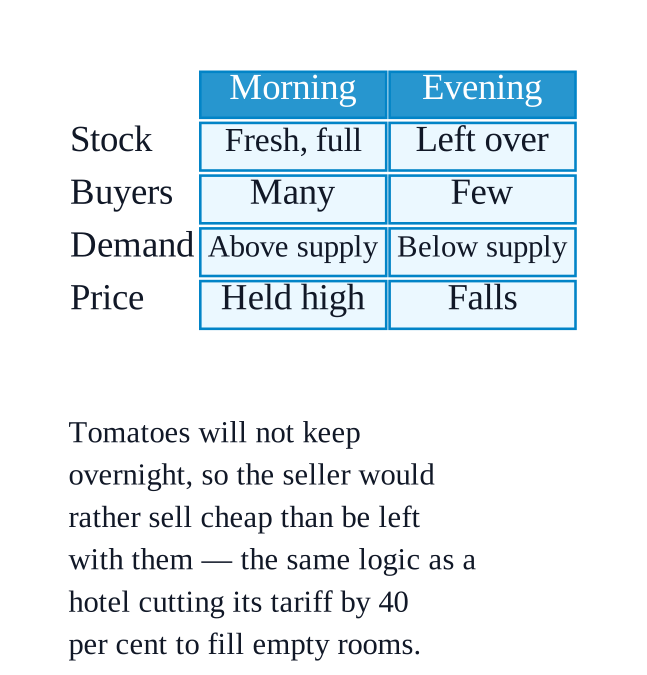
    In the morning the stock is fresh and full, and the buyers who want the best pick come early — demand is high, so the seller can hold his price.
    By evening most buyers have gone but unsold tomatoes remain: supply now exceeds the demand that is left, so the price falls.
    The seller would rather sell cheap than be left with a perishable good that will spoil overnight — the same logic as a hotel cutting its tariff by $\displaystyle 40$ per cent overnight to fill empty rooms.
    What a good answer must contain
    The market you visited and the day you went.
    At least two vegetables with the prices you were actually quoted.
    Each answer explained with demand or supply, not just repeated as the seller said it.
  10. Exercise 9.10

    Categorise the following combination of goods into substitute goods and complementary goods. a. Movie ticket in the cinema hall and popcorn b. Eraser and pencil c. Laptop and computer d. Air Conditioner and cooler e. Notebook and pen f. Apple and banana g. Mobile and earphones

    The book prints no answer for this

    NCERT publishes no answers for this textbook, so there is nothing in the book to check this working against. It has also not yet been read through by hand.

    Substitutes replace each other; complements are used together.
    Substitute goods
    c. Laptop and computer — either one does the same job, so a buyer chooses between them.
    d. Air conditioner and cooler — both cool a room; if ACs become dearer, buyers move to coolers.
    f. Apple and banana — one fruit can be bought in place of the other, just as Srivalli buys bananas when mangoes are beyond her budget.
    Complementary goods
    a. Movie ticket in the cinema hall and popcorn — the chapter's own example: costlier tickets mean fewer people in the hall, so less popcorn is sold.
    b. Eraser and pencil — used together while writing.
    e. Notebook and pen — used together, so buying one leads to buying the other.
    g. Mobile and earphones — the chapter's example of goods used together to give the consumer utility.
    The test to use
    Ask: if this one becomes costlier, do I buy more of the other, or less?
    More → substitutes. Less → complements.
  11. Exercise 9.11

    Fig. 9.8\displaystyle 9.8 shows the demand curve DD’ and Supply curve SS’. Based on the figure, answer the following questions: a. What does point E represent in this market? b. What is the equilibrium price and equilibrium quantity at point E? c. Point A lies on DD’. Point B lies on SS’. What do the points A and B indicate about demand and supply? What does the gap between A and B (both on the upper dashed price line) represent? d. Point F lies on DD’. Point C lies on SS’. What do the points F and C indicate about demand and supply? What does the gap between C and F (both on the lower dashed price line) represent? e. If the price stays at the lower dashed line, what could happen next in a free market? Y D S’ 400\displaystyle 400 300\displaystyle 300 Price(₹) 200\displaystyle 200 100\displaystyle 100 SNCERT_Question_Class9_SocialScience_Ch9_QA_Q9-11

    The book prints no answer for this

    NCERT publishes no answers for this textbook, so there is nothing in the book to check this working against. It has also not yet been read through by hand.

    a. What point E representsNCERT_Solution_Class9_SocialScience_Ch9_QA_Q9-11
    E is the market equilibrium — the single point where the demand curve DD' and the supply curve SS' cut each other.
    Here quantity demanded equals quantity supplied, so there is neither a shortage nor a surplus and the market is 'cleared'.
    At E there is no pressure on the price to move.
    b. The equilibrium price and quantity
    Equilibrium price = ₹$\displaystyle 200$, read across from E to the price axis.
    Equilibrium quantity = $\displaystyle 30$ kg, read down from E to the quantity axis.
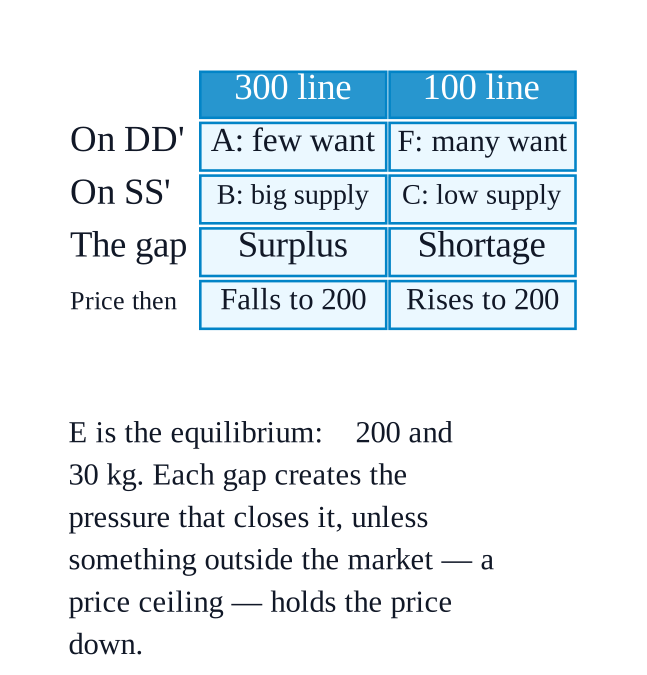
    c. Points A and B, on the upper dashed line (₹$\displaystyle 300$)
    Both are read at a price above equilibrium.
    A lies on DD' — at ₹$\displaystyle 300$ buyers want only a small quantity, because a high price cuts quantity demanded.
    B lies on SS' — at ₹$\displaystyle 300$ sellers are willing to offer a much larger quantity, because a high price is profitable.
    The gap from A to B is excess supply, that is, a surplus — the quantity offered that nobody is willing to buy at ₹300.
    d. Points F and C, on the lower dashed line (₹$\displaystyle 100$)
    Both are read at a price below equilibrium.
    F lies on DD' — at ₹$\displaystyle 100$ buyers want a large quantity.
    C lies on SS' — at ₹$\displaystyle 100$ sellers offer only a small quantity, because the low price is not worth their while.
    The gap from C to F is excess demand, that is, a shortage — the quantity buyers want but cannot get at ₹100.
    e. If the price stays at the lower dashed line
    In a free market it will not stay there for long.
    With excess demand, buyers compete for a small quantity and some are willing to pay more, while sellers see they can charge more.
    The price is bid upward towards ₹$\displaystyle 200$: as it rises, quantity demanded falls and quantity supplied rises, so the gap narrows.
    The market returns to E — unless something outside the market, such as a price ceiling, holds the price down. Then the shortage stays, and queues, hoarding or black-marketing can follow.
  12. Exercise 9.12

    Draw a market equilibrium graph using the following demand schedule. Price (₹) 10\displaystyle 10 20\displaystyle 20 30\displaystyle 30 40\displaystyle 40 50\displaystyle 50 Q.D. (kg) 5\displaystyle 5 10\displaystyle 10 15\displaystyle 15 20\displaystyle 20 25\displaystyle 25 Q.S. (kg) 25\displaystyle 25 20\displaystyle 20 15\displaystyle 15 10\displaystyle 10 5\displaystyle 5 a. Plot the demand and supply curve using the above data. b. Identify the equilibrium price and quantity. c. Observe the above data and analyse what happens if the price is set at ₹20\displaystyle 20 or ₹40.NCERT_Question_Class9_SocialScience_Ch9_QA_Q9-12

    The book prints no answer for this

    NCERT publishes no answers for this textbook, so there is nothing in the book to check this working against. It has also not yet been read through by hand.

    a. Plotting the two curvesNCERT_Solution_Class9_SocialScience_Ch9_QA_Q9-12
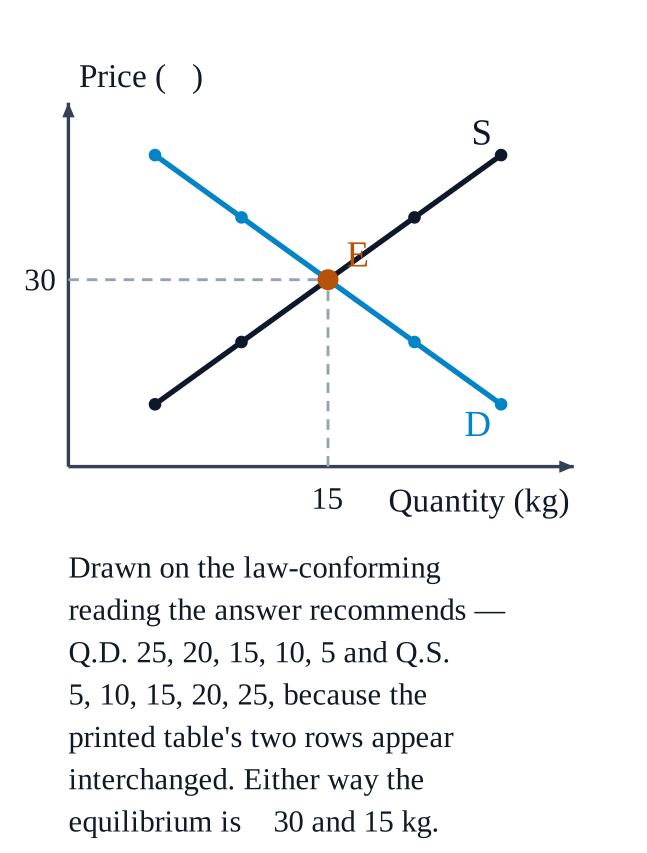
    Put price on the y-axis (₹$\displaystyle 10$ to ₹$\displaystyle 50$) and quantity on the x-axis ($\displaystyle 0$ to $\displaystyle 25$ kg), and label both axes.
    Q.D. points from the table: ($\displaystyle 5$, ₹$\displaystyle 10$), ($\displaystyle 10$, ₹$\displaystyle 20$), ($\displaystyle 15$, ₹$\displaystyle 30$), ($\displaystyle 20$, ₹$\displaystyle 40$), ($\displaystyle 25$, ₹$\displaystyle 50$).
    Q.S. points: ($\displaystyle 25$, ₹$\displaystyle 10$), ($\displaystyle 20$, ₹$\displaystyle 20$), ($\displaystyle 15$, ₹$\displaystyle 30$), ($\displaystyle 10$, ₹$\displaystyle 40$), ($\displaystyle 5$, ₹$\displaystyle 50$).
    Join each set of five points. The two straight lines cross at exactly one point — mark it E.
    b. The equilibrium
    Equilibrium price = ₹$\displaystyle 30$ and equilibrium quantity = $\displaystyle 15$ kg.
    This is the only row in the table where Q.D. = Q.S., so it is the only price at which the market clears — no surplus and no shortage.
    c. If the price is set at ₹$\displaystyle 20$ or at ₹$\displaystyle 40$
    Neither price can last. At ₹$\displaystyle 20$ and at ₹$\displaystyle 40$ the two quantities differ by $\displaystyle 10$ kg, so the market does not clear at either price — one side of the market is left unsatisfied and the price is under pressure to move.
    Reading the table exactly as printed: at ₹$\displaystyle 20$, $\displaystyle 10$ kg is demanded against $\displaystyle 20$ kg supplied — an excess supply (surplus) of $\displaystyle 10$ kg; at ₹$\displaystyle 40$, $\displaystyle 20$ kg is demanded against $\displaystyle 10$ kg supplied — an excess demand (shortage) of $\displaystyle 10$ kg.
    The printed rows run against both laws of this chapter. Q.D. rises as price rises and Q.S. falls, whereas the Law of Demand is an inverse relationship and the law of supply a direct one. Read the rows the way the two laws require — Q.D. $\displaystyle 25$, $\displaystyle 20$, $\displaystyle 15$, $\displaystyle 10$, $\displaystyle 5$ and Q.S. $\displaystyle 5$, $\displaystyle 10$, $\displaystyle 15$, $\displaystyle 20$, $\displaystyle 25$ — and the equilibrium is still ₹$\displaystyle 30$ and $\displaystyle 15$ kg, but the two labels swap: ₹$\displaystyle 20$ becomes the shortage and ₹$\displaystyle 40$ the surplus.
    On that law-conforming reading the market comes back to ₹30. At ₹$\displaystyle 20$ the shortage makes buyers compete for too little, which pushes the price up; at ₹$\displaystyle 40$ the surplus makes sellers cut prices to clear unsold stock, which pushes the price down. Both arrows point at ₹$\displaystyle 30$, where Q.D. = Q.S. and the market is ‘cleared’.
    On the numbers exactly as printed, the same pressures push the price away from ₹$\displaystyle 30$, not back to it. The surplus at ₹$\displaystyle 20$ pushes the price down to ₹$\displaystyle 10$, where the surplus is wider still — $\displaystyle 5$ kg demanded against $\displaystyle 25$ kg supplied, a gap of $\displaystyle 20$ kg; the shortage at ₹$\displaystyle 40$ pushes the price up to ₹$\displaystyle 50$, where the gap is again $\displaystyle 20$ kg. Taken literally, ₹$\displaystyle 30$ is a balance the market moves away from once it leaves it.
    What to write in your answer: give the law-conforming analysis (₹$\displaystyle 20$ → shortage → price rises; ₹$\displaystyle 40$ → surplus → price falls; both back to ₹$\displaystyle 30$), and add one line noting that the Q.D. and Q.S. rows in the printed table appear to be interchanged. Check with your teacher which reading is intended.