SolveItClass 9 · NCERT

NCERT Solutions · Class 9 Science Sound Waves: Characteristics and Applications

28 questions · 16 still being checked

Revise, Reflect, Refine 10.6–10.7 (part 9 of 21)

  1. Exercise 10.6

    The sound waves emitted by three sources A, B and C are represented in Fig. 10.31. If the frequency of A is maximum and C is minimum, identify the corresponding curves, and mark A, B and C on them.NCERT_Question_Class9_Science_Ch10_RRR_Q10-6

    Not cross-checked

    NCERT prints no numerical answer for this exercise, so this working has not been cross-checked against the book.

    NCERT’s answer
    A - Green curve; B - Red curve; C - Blue curve
    A is the green curve, B is the red curve and C is the blue curve.
    All three waves travel in the same medium, so they share one speed \(\displaystyle v \), and \(\displaystyle v = \nu \times \lambda \) gives \(\displaystyle \lambda = \dfrac{v}{\nu} \) — the highest frequency must have the shortest wavelength.
    A has the maximum frequency, so mark A on the curve whose crests are packed closest together — the green one.
    C has the minimum frequency, so mark C on the curve with the widest crest-to-crest spacing — the blue one.
    B is left with the in-between spacing, the red curve, giving \(\displaystyle \lambda_A < \lambda_B < \lambda_C \) while \(\displaystyle \nu_A > \nu_B > \nu_C \).
    Write the letters A, B and C directly on their three curves in Fig. 10.31.
  2. Exercise 10.7

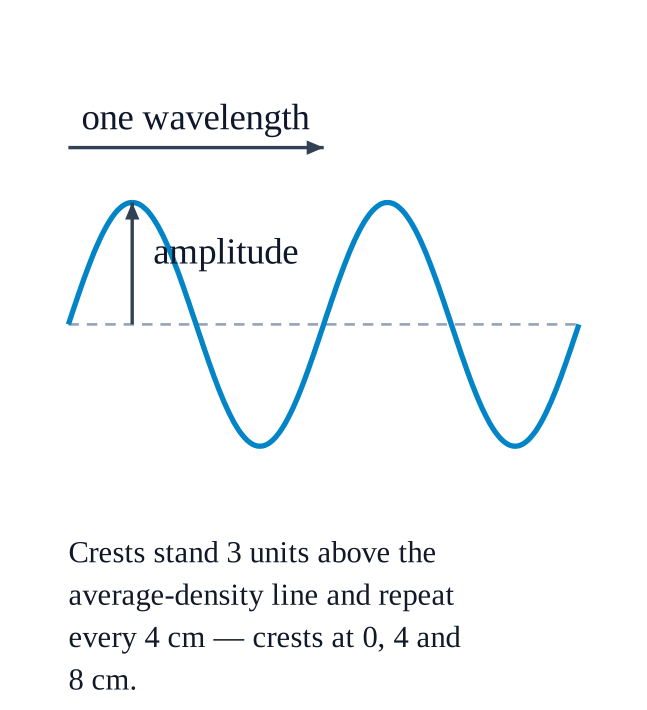
    Draw a graph to represent a sound wave for which the density amplitude is 3\displaystyle 3 units and wavelength is 4\displaystyle 4 cm.

    Not cross-checked

    NCERT prints no numerical answer for this exercise, so this working has not been cross-checked against the book.

    Draw a density-versus-distance graph whose crests stand $\displaystyle 3$ units above the average-density line and which repeats every \(\displaystyle 4\ \text{cm} \). It must contain:
    NCERT_Solution_Class9_Science_Ch10_RRR_Q10-7
    An x-axis labelled "Distance (cm)", marked \(\displaystyle 0, 1, 2, 3, 4, 5, \ldots \) up to at least $\displaystyle 8$ cm.
    A y-axis labelled "Density (units)", marked from \(\displaystyle -3 \) to \(\displaystyle +3 \) about the average value.
    A horizontal dashed line right across the graph for the average density — the level the curve oscillates about.
    A smooth wave whose crests sit exactly $\displaystyle 3$ units above the dashed line and whose troughs dip $\displaystyle 3$ units below it; that $\displaystyle 3$ units is the density amplitude.
    A crest-to-crest spacing of \(\displaystyle \lambda = 4\ \text{cm} \): put crests at \(\displaystyle 0,\ 4\ \text{and}\ 8\ \text{cm} \), troughs midway between them at \(\displaystyle 2\ \text{and}\ 6\ \text{cm} \), and the curve crossing the dashed line at \(\displaystyle 1,\ 3,\ 5\ \text{and}\ 7\ \text{cm} \).
    C marked under each crest and R under each trough, with a double-headed arrow between two consecutive crests labelled \(\displaystyle \lambda = 4\ \text{cm} \).
    At least two full cycles, so that the repetition is visible.