SolveItClass 9 · NCERT

NCERT Solutions · Class 9 Science Describing Motion Around Us

23 questions · 13 still being checked

Pause and Ponder 4.1–4.7 (part 1 of 3)

  1. Exercise 4.1

    In the example of an athlete running back and forth on a straight track (Fig. 4.4\displaystyle 4.4), when will the displacement of the athlete be zero? What will be the total distance travelled in that case?NCERT_Question_Class9_Science_Ch4_PP_Q4-1

    Not cross-checked

    NCERT prints no numerical answer for this exercise, so this working has not been cross-checked against the book.

    The displacement is zero whenever the athlete is back at her starting point O, because her position at the final instant is then the same as her position at the first instant.
    In Fig. $\displaystyle 4.4$ this happens if she runs from O out to A and then returns all the way to O, instead of stopping at B.
    The total distance in that case is \(\displaystyle \text{OA} + \text{AO} = 100\ \text{m} + 100\ \text{m} = 200\ \text{m} \).
    So zero displacement does not mean zero distance — distance keeps adding up along the whole path travelled, while displacement only compares the two end positions.
  2. Exercise 4.2

    Fuel used up in a vehicle depends on which of the following? Justify your answer. (i) Total distance travelled (ii) Displacement

    Not cross-checked

    NCERT prints no numerical answer for this exercise, so this working has not been cross-checked against the book.

    Fuel used up depends on (i) the total distance travelled.
    Fuel is burnt for every metre the vehicle actually covers, whichever direction it happens to be pointing, so it is the length of the path that empties the tank.
    Displacement compares only the starting and the finishing position. A vehicle that drives out and comes back has displacement \(\displaystyle 0\ \text{m} \), yet it has certainly used fuel — so displacement cannot decide the fuel consumed.
    Example: the athlete's route O → A → O in Fig. $\displaystyle 4.4$ has displacement \(\displaystyle 0\ \text{m} \) but a path length of \(\displaystyle 200\ \text{m} \); a vehicle on that route would burn fuel for all \(\displaystyle 200\ \text{m} \).
    NCERT_Solution_Class9_Science_Ch4_PP_Q4-2
  3. Exercise 4.3

    A ball rolls down an inclined track as shown in Fig. 4.6. Is its motion, a straight line motion? Assuming the starting point of the ball (O) to be the origin, can its motion from O to D be depicted using a horizontal line as shown in Fig. 4.3\displaystyle 4.3? Are the values of total distance travelled and magnitude of displacement from O equal or different at positions A, B, C and D?NCERT_Question_Class9_Science_Ch4_PP_Q4-3NCERT_Question_Class9_Science_Ch4_PP_Q4-3-2

    Check this one against your book

    NCERT’s printed answer for this exercise does not match its own question. This working follows the question as printed.

    Yes, it is motion in a straight line. The sloping face of the track in Fig. $\displaystyle 4.6$ is a single straight segment running from O down to D; the ball stays on it throughout. A straight line need not be horizontal — only the path matters, not its tilt.
    Yes, it can be depicted on a line like Fig. 4.3. Take O as the origin and mark the distances measured along the track. Fig. $\displaystyle 4.6$ dimensions the slope in four pieces, \(\displaystyle \text{OA} = 40\ \text{cm} \), \(\displaystyle \text{AB} = 10\ \text{cm} \), \(\displaystyle \text{BC} = 20\ \text{cm} \), \(\displaystyle \text{CD} = 30\ \text{cm} \), so on such a line A is at \(\displaystyle 40\ \text{cm} \), B at \(\displaystyle 40 + 10 = 50\ \text{cm} \), C at \(\displaystyle 50 + 20 = 70\ \text{cm} \) and D at \(\displaystyle 70 + 30 = 100\ \text{cm} \). The line records only position along the path with respect to the origin; the tilt of the real track adds no information once the motion is along one straight line.
    The two are equal at every one of A, B, C and D. The ball rolls one way and never turns back, so by the chapter's Note — for motion in a straight line the total distance travelled and the magnitude of displacement are equal if the object moves in one direction — the total distance travelled from O equals the magnitude of displacement from O: \(\displaystyle 40\ \text{cm} \) at A, \(\displaystyle 50\ \text{cm} \) at B, \(\displaystyle 70\ \text{cm} \) at C and \(\displaystyle 100\ \text{cm} \) at D, the displacement being directed from O down the slope towards D.
    What does differ is the value from one position to the next, \(\displaystyle 40 \rightarrow 50 \rightarrow 70 \rightarrow 100\ \text{cm} \); at each single position, distance and magnitude of displacement agree.
  4. Exercise 4.4

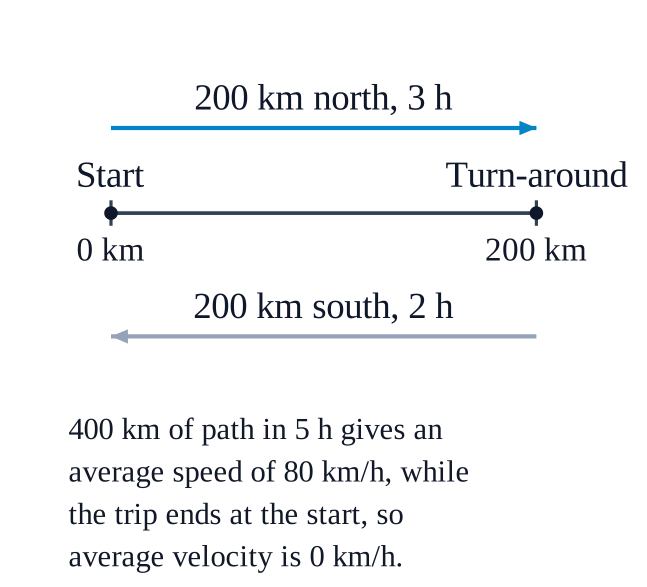
    During a family road trip, you drive 200\displaystyle 200 km north in three hours. Afterwards, you drive 200\displaystyle 200 km south in two hours. Find the average speed and average velocity for your entire trip.

    Disagrees with the book

    This working does not reach the answer printed in NCERT. One of the two is wrong and it has not yet been settled which — check it before you rely on it.

    NCERT’s answer
    $\displaystyle 80$ km \(\displaystyle h^{- 1}\); $\displaystyle 0$ km \(\displaystyle h^{- 1}\)
    Average speed \(\displaystyle = 80\ \text{km h}^{-1} \); average velocity \(\displaystyle = 0\ \text{km h}^{-1} \).
    NCERT_Solution_Class9_Science_Ch4_PP_Q4-4
    Total distance travelled \(\displaystyle = 200\ \text{km} + 200\ \text{km} = 400\ \text{km} \); total time \(\displaystyle = 3\ \text{h} + 2\ \text{h} = 5\ \text{h} \).
    \(\displaystyle \text{average speed} = \frac{400\ \text{km}}{5\ \text{h}} = 80\ \text{km h}^{-1} \)
    Displacement: $\displaystyle 200$ km north followed by $\displaystyle 200$ km south brings you back to the starting point, so \(\displaystyle s = 0\ \text{km} \).
    \(\displaystyle v_{av} = \frac{0\ \text{km}}{5\ \text{h}} = 0\ \text{km h}^{-1} \)
    The two differ because speed is built from the path length ($\displaystyle 400$ km) while velocity is built from the net change in position ($\displaystyle 0$ km).
  5. Exercise 4.5

    Under what condition(s) is the (i) magnitude of average velocity of an object equal to its average speed? (ii) magnitude of average velocity of an object zero while its average speed is not zero?

    Not cross-checked

    NCERT prints no numerical answer for this exercise, so this working has not been cross-checked against the book.

    (i) They are equal when the object moves in a straight line in one direction only, never turning back — then the total distance travelled equals the magnitude of displacement, so dividing either by the same time interval gives the same number.
    NCERT_Solution_Class9_Science_Ch4_PP_Q4-5
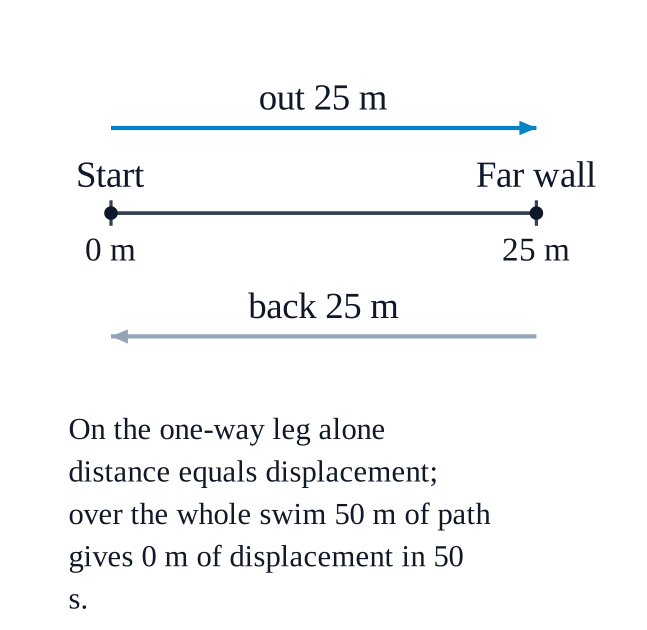
    (ii) The magnitude of average velocity is zero while the average speed is not, when the object returns to its starting position by the end of the time interval — the displacement is \(\displaystyle 0\ \text{m} \) but the path actually covered is not zero.
    Worked example for (ii): Sarang swims $\displaystyle 25$ m and back in $\displaystyle 50$ s (Example $\displaystyle 4.2$), so \(\displaystyle v_{av} = \frac{0\ \text{m}}{50\ \text{s}} = 0\ \text{m s}^{-1} \) while \(\displaystyle \text{average speed} = \frac{50\ \text{m}}{50\ \text{s}} = 1\ \text{m s}^{-1} \).
    One complete revolution on a circular path is another such case: distance \(\displaystyle = 2\pi R \), displacement \(\displaystyle = 0 \).
  6. Exercise 4.6

    Begin plotting points on the graph paper to represent each set of time and position values from Table 4.3. (i) Table 4.3\displaystyle 4.3 shows that at time 0\displaystyle 0 s, the position is also 0\displaystyle 0 m. The point corresponding to this set of values on the graph will therefore be the origin itself. (ii) At 1\displaystyle 1 s, the position of vehicle is at 20\displaystyle 20 m. To mark these values, look for the point that represents 1\displaystyle 1 s on the X-axis. Draw a line parallel to the Y-axis at

    Not cross-checked

    NCERT prints no numerical answer for this exercise, so this working has not been cross-checked against the book.

    The seven points to be plotted from Table $\displaystyle 4.3$ are ($\displaystyle 0$ s, $\displaystyle 0$ m), ($\displaystyle 1$ s, $\displaystyle 20$ m), ($\displaystyle 2$ s, $\displaystyle 40$ m), ($\displaystyle 3$ s, $\displaystyle 60$ m), ($\displaystyle 4$ s, $\displaystyle 80$ m), ($\displaystyle 5$ s, $\displaystyle 100$ m) and ($\displaystyle 6$ s, $\displaystyle 120$ m).
    NCERT_Solution_Class9_Science_Ch4_PP_Q4-6
    Axes and scale: time along the X-axis with $\displaystyle 5$ divisions \(\displaystyle = 1\ \text{s} \), position along the Y-axis with $\displaystyle 5$ divisions \(\displaystyle = 20\ \text{m} \).
    The point ($\displaystyle 0$ s, $\displaystyle 0$ m) needs no construction — it is the origin O itself.
    For ($\displaystyle 1$ s, $\displaystyle 20$ m): draw a line parallel to the Y-axis through the $\displaystyle 1$ s mark on the X-axis, and a line parallel to the X-axis through the $\displaystyle 20$ m mark on the Y-axis; the point where the two lines intersect is the required point.
    Repeat this construction for the remaining pairs. The seven points come out equally spaced and all lie along one straight line.
  7. Exercise 4.7

    Once all points are plotted, connect them to create the position-time graph for the vehicle’s motion (Fig. 4.11c). It is a straight line for the data given in Table 4.3. This was an example of plotting a position-time graph. Similar procedure can be used to plot the other graphs which you will be learning ahead. Ready to Go Beyond The intermediate points represent possible values for position of vehicle at intermediate times. They are correct if vehicle is moving with a constant speed. Example 4.5\displaystyle 4.5: For a vehicle starting from rest and speeding up, the data for position and time are given in Table 4.4. Plot the position-time graph corresponding to it. Answer: Choosing the scale to be X-axis: 5\displaystyle 5 divisions = 2\displaystyle 2 s Y-axis: 5\displaystyle 5 divisions = 5\displaystyle 5 m and following the procedure of Activity 4.3\displaystyle 4.3, all points corresponding to positions of the vehicle at different instants of time are marked. Unlike Fig. 4.11c, the points do not fall on a straight line. The points can be joined by a curve as shown in Fig. 4.12. Now that you know how to plot a graph from the data given for the motion of an object, let us learn to interpret the graphs.NCERT_Question_Class9_Science_Ch4_PP_Q4-7NCERT_Question_Class9_Science_Ch4_PP_Q4-7-2

    Not cross-checked

    NCERT prints no numerical answer for this exercise, so this working has not been cross-checked against the book.

    Joining the plotted points of Table $\displaystyle 4.3$ gives a straight line passing through the origin (Fig. 4.11c) — the position-time graph of the vehicle.
    A straight-line position-time graph means the velocity is constant: the object covers equal displacements in equal intervals of time.
    The slope of that line gives the velocity: \(\displaystyle v = \frac{120\ \text{m} - 0\ \text{m}}{6\ \text{s} - 0\ \text{s}} = 20\ \text{m s}^{-1} \).
    The points between the plotted ones stand for genuine positions at in-between instants only because the vehicle is moving at a constant speed.
    Contrast with Example $\displaystyle 4.5$ (Table $\displaystyle 4.4$): there the points do not fall on a straight line and are joined by a curve (Fig. $\displaystyle 4.12$), which means the velocity is changing — accelerated motion.