How to draw one graph (worked example: Delhi)
x-axis: the twelve months, Jan to Dec.
Left y-axis: temperature in °C. Right y-axis: rainfall in cm. Fig. $\displaystyle 3.14$ uses two scales like this.
Plot rainfall as bars and temperature as a line joining the twelve points.
Delhi's temperatures: $\displaystyle 14.4$, $\displaystyle 16.7$, $\displaystyle 23.3$, $\displaystyle 30.0$, $\displaystyle 33.3$, $\displaystyle 33.3$, $\displaystyle 30.0$, $\displaystyle 29.4$, $\displaystyle 28.9$, $\displaystyle 25.6$, $\displaystyle 19.4$, $\displaystyle 15.6$°C.
Delhi's rainfall: $\displaystyle 2.5$, $\displaystyle 1.5$, $\displaystyle 1.3$, $\displaystyle 1.0$, $\displaystyle 1.8$, $\displaystyle 7.4$, $\displaystyle 19.3$, $\displaystyle 17.8$, $\displaystyle 11.9$, $\displaystyle 1.3$, $\displaystyle 0.2$, $\displaystyle 1.0$ cm — $\displaystyle 67.0$ cm for the year.
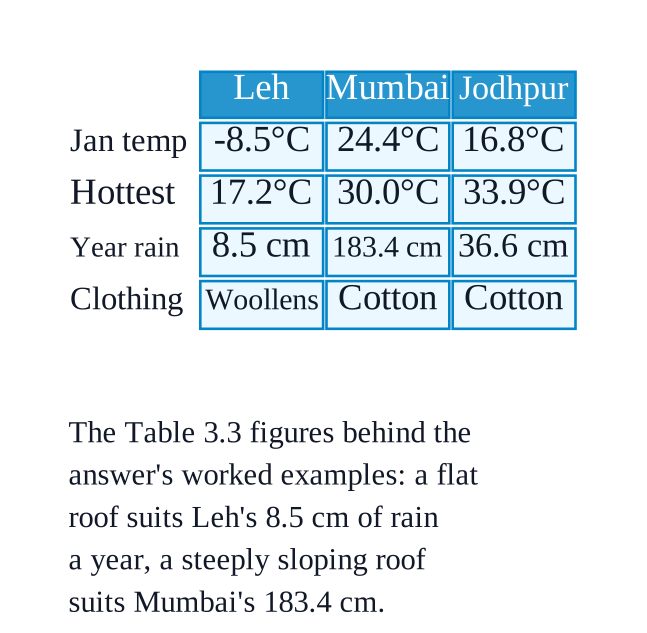
Fig. $\displaystyle 3.14$ is this very graph, already drawn for you; draw the other nine rows of Table $\displaystyle 3.3$ the same way and set them side by side.
Careful with Leh: its temperatures go below zero, so its scale must start at about −$\displaystyle 10$°C.
Broad generalisations the ten graphs should show
Rain is squeezed into a few months almost everywhere — nine of the ten stations have their wettest month inside June–September.
Chennai is the exception: its tall bars stand in October and November.
The totals are wildly different: Shillong $\displaystyle 225.3$ cm against Leh $\displaystyle 8.5$ cm.
Temperature swings grow with distance from the equator: Thiruvananthapuram stays between $\displaystyle 26.2$ and $\displaystyle 28.7$°C all year; Leh runs from −$\displaystyle 8.5$ to $\displaystyle 17.2$°C.
Altitude cools a place whatever its latitude: Shillong ($\displaystyle 1461$ m, $\displaystyle 24$°$\displaystyle 34$'N) is cooler in every month than Delhi ($\displaystyle 219$ m, $\displaystyle 29$°N).
$\displaystyle 7.1$ The ten stations by distance from the equator (nearest first)
1.
Thiruvananthapuram — $\displaystyle 8$°$\displaystyle 29$'N
2.
Bengaluru — $\displaystyle 12$°$\displaystyle 58$'N
3.
Chennai — $\displaystyle 13$°$\displaystyle 4$'N
4.
Mumbai — $\displaystyle 19$°N
5.
Nagpur — $\displaystyle 21$°$\displaystyle 9$'N
6.
Kolkata — $\displaystyle 22$°$\displaystyle 34$'N
7.
Shillong — $\displaystyle 24$°$\displaystyle 34$'N
8.
Jodhpur — $\displaystyle 26$°$\displaystyle 18$'N
9.
Delhi — $\displaystyle 29$°N
10.
Leh — $\displaystyle 34$°N
$\displaystyle 7.2$ a. Two stations with the most extreme climate
Leh and Jodhpur.
Leh: −$\displaystyle 8.5$°C in January to $\displaystyle 17.2$°C in July — a swing of about $\displaystyle 25.7$°C — and only $\displaystyle 8.5$ cm of rain in the whole year.
Jodhpur: $\displaystyle 14.9$°C in December to $\displaystyle 33.9$°C in June — a swing of about $\displaystyle 19.0$°C — with only $\displaystyle 36.6$ cm of rain.
Delhi is a very close third ($\displaystyle 14.4$°C to $\displaystyle 33.3$°C, a swing of $\displaystyle 18.9$°C), so it is a fair second answer if your teacher reads the table that way.
$\displaystyle 7.2$ b. Two stations influenced by retreating monsoons
Chennai and Bengaluru.
Chennai's two wettest months are October ($\displaystyle 30.6$ cm) and November ($\displaystyle 35.0$ cm) — after the south-west monsoon has withdrawn.
Bengaluru keeps raining late too: September $\displaystyle 16.4$ cm and October $\displaystyle 15.3$ cm.
The chapter says the winter or north-east monsoon waters Tamil Nadu, Andhra Pradesh and parts of Karnataka — and these two stations lie in those states.
Thiruvananthapuram also shows an October–November rise ($\displaystyle 27.3$ and $\displaystyle 20.6$ cm), but Kerala is not in the chapter's list.
$\displaystyle 7.2$ c. The two hottest stations
(i) February — Thiruvananthapuram $\displaystyle 27.3$°C, then Chennai $\displaystyle 25.7$°C.
(ii) June — Jodhpur $\displaystyle 33.9$°C, then Delhi $\displaystyle 33.3$°C.
Notice the switch: in February the hottest places are the ones nearest the equator; in June they are the dry north-western stations.
$\displaystyle 7.3$ a. Why Shillong gets more rain than Kolkata
Shillong receives $\displaystyle 225.3$ cm a year, Kolkata $\displaystyle 162.5$ cm.
The chapter lists mountains among the factors affecting precipitation. Shillong stands at $\displaystyle 1461$ m; Kolkata is at just $\displaystyle 6$ m.
The moist south-west monsoon winds coming off the Bay of Bengal are forced to rise over the hills at Shillong, and rising moist air condenses and precipitates.
Kolkata lies on flat, low land, so the same winds pass over it without being lifted in the same way.
$\displaystyle 7.3$ b. Why Delhi receives more rain than Jodhpur
Delhi gets $\displaystyle 67.0$ cm a year, Jodhpur only $\displaystyle 36.6$ cm.
Both peak in July and August, so both are fed by the same south-west monsoon — the difference is how much moisture reaches them.
Jodhpur lies further west, into the dry north-west of the country, which the monsoon reaches last and with the least moisture left; Fig. $\displaystyle 3.10$ shows the onset dates getting later towards the north-west.
Ask your teacher: the chapter does not print a reason for this particular pair. All it gives is the general rule that precipitation depends on prevailing winds, mountains and seasons.
$\displaystyle 7.4$ a. Why Thiruvananthapuram has an equable climate
Its monthly temperatures stay between $\displaystyle 26.2$°C and $\displaystyle 28.7$°C — barely $\displaystyle 2.5$°C apart across the whole year.
It is the station nearest the equator ($\displaystyle 8$°$\displaystyle 29$'N), and insolation, and therefore temperature, decreases from the equator towards the poles — so near the equator it hardly changes with the seasons.
It is on the coast: the chapter says land and sea breezes are essential in creating moderate climatic conditions in coastal regions.
Its rain is spread over many months ($\displaystyle 181.2$ cm a year, with a June peak and a second rise in October–November), which also keeps it from ever becoming very hot.
$\displaystyle 7.4$ b. Why Chennai gets its rain after the monsoon is over elsewhere
Chennai's main rainy season is the north-east (winter) monsoon, not the south-west one.
From October to February the winds blow from land to sea; crossing the Bay of Bengal they pick up moisture and rain on India's eastern coast, especially Tamil Nadu.
The table proves it: October $\displaystyle 30.6$ cm and November $\displaystyle 35.0$ cm, against only $\displaystyle 4.5$, $\displaystyle 8.7$, $\displaystyle 11.3$ and $\displaystyle 11.9$ cm in June, July, August and September.
Fig. $\displaystyle 3.11$ also shows the monsoon retreating from the far south last, around $\displaystyle 15$ October.
$\displaystyle 7.4$ c. Why Leh has moderate precipitation almost throughout the year
Leh's whole year adds up to only $\displaystyle 8.5$ cm, and it is spread thin — no month gets more than $\displaystyle 1.3$ cm, and November gets none at all (Table $\displaystyle 3.3$ prints a dash there) — so there is no monsoon peak at all.
Its wettest months, July and August, bring just $\displaystyle 1.3$ cm each; most other months bring between $\displaystyle 0.5$ and $\displaystyle 1.0$ cm.
It sits at $\displaystyle 3506$ m and $\displaystyle 34$°N, high in the mountains and far inland, so the moist monsoon winds do not reach it with much water left to give.
Ask your teacher: the chapter does not explain Leh directly. It only says that mountains and prevailing winds affect precipitation, and that the Himalayan areas are more temperate.
$\displaystyle 7.5$ Do the monsoons lend climatic unity to the whole country?
Yes — behind ten very different places the table shows one rhythm.
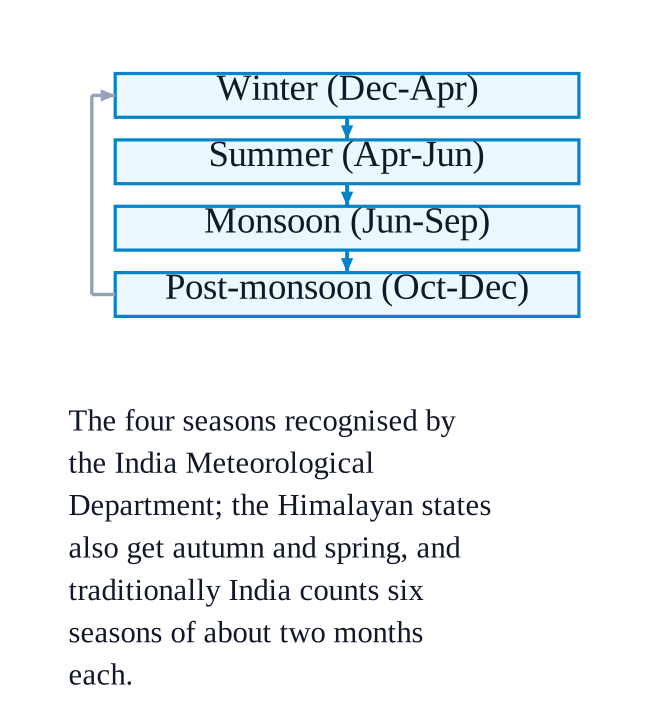
Nine of the ten stations have their wettest month inside June–September, the south-west monsoon season, and the chapter says that monsoon accounts for most of the rainfall in the country through the year.
Even the exception belongs to the same system: Chennai and the east coast are watered by the other half of the same seasonal reversal, the north-east monsoon.
The whole country waits on the same event — most of India's agriculture depends on monsoon rainfall, and the monsoon also shapes daily life, transport, festivals and employment.
India shares the failures too: a weak monsoon means drought, an excessive one means floods, as in the Punjab floods of $\displaystyle 2025$ described in this chapter.
So the amounts differ enormously — $\displaystyle 225.3$ cm at Shillong, $\displaystyle 8.5$ cm at Leh — but the timing and the dependence are shared, and that is the unity.


 1. Winter

 Why
Why