✓ Board-verified
Physics · 2025 · 1 mark
CBSE 2025 · Region 6 · Set 1 · Q1
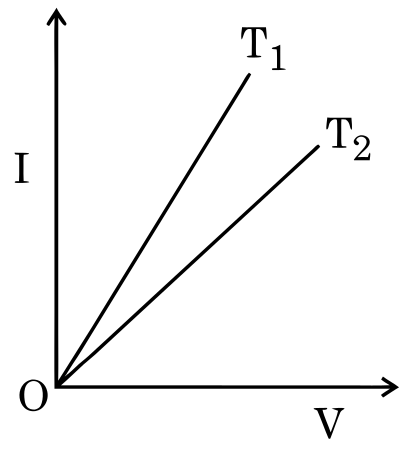
The figure shows the voltage (V) versus the current (I) graphs for a wire at two temperatures T_1 and T_2. One can conclude that:
The figure shows the voltage (V) versus the current (I) graphs for a wire at two temperatures $\displaystyle \mathrm{T}_{1}$ and $\displaystyle \mathrm{T}_{2}$. One can conclude that :
Official answer
(D)
$\displaystyle \mathrm{T}_{1}<\mathrm{T}_{2}$
All Current Electricity questions2025 question paperNCERT solutions: Current ElectricityPractice Current Electricity →
More from Current Electricity
- A steady current flows through a metallic wire whose area of cross-section increases continuously from one end of the wire to the other. The…2023
- (i) Define mobility of electrons. Give its SI units. (ii) A steady current flows through a wire AB, as shown in the figure. What happens to the…2023
- What is the order of magnitude of drift velocity of electrons in a conductor? Deduce the relation between the current flowing through a conductor and…2026
- 'Current is a scalar quantity, although we represent current with an arrow.' Explain. Derive the balance condition of a Wheatstone Bridge.2026
- The number of electrons flowing through a conductor per second is 3 · 3 × 10^19. The current flowing through the conductor is:2023
- A student sets up the circuit as shown in the figure to find the value of unknown resistance X and records a set of readings of the voltmeter and the…2026
- Define current density and relaxation time. Derive an expression for resistivity of a conductor in terms of number density of charge carriers in the…2023
- A battery of e. m. f. 12 V and internal resistance 0.5 Ω is connected to a 9.5 Ω resistor through a key. The ratio of potential difference between…2025
CBSE Class 12 Physics past-paper question from the 2025 board exam, with the answer as CBSE’s own marking scheme gives it. Where our answers come from.