✓ Board-verified
Mathematics · 2025 · 1 mark
CBSE 2025 · Region 2 · Set 1 · Q15
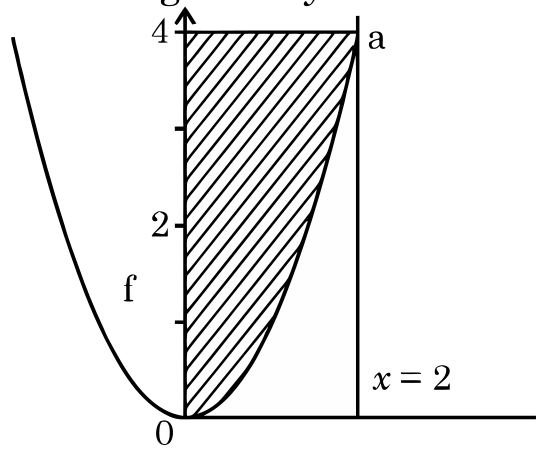
The area of the shaded region (figure) represented by the curves y =x^2, 0 ≤ x ≤ 2 and y -axis is given by
The area of the shaded region (figure) represented by the curves $\displaystyle \mathrm{y}=x^{2}, 0 \leq x \leq 2$ and y -axis is given by
Official answer
(D)
$\displaystyle \int_{0}^{4} \sqrt{\mathrm{y}} d \mathrm{y}$
All Application of Integrals questions2025 question paperNCERT solutions: Application of IntegralsPractice Application of Integrals →
More from Application of Integrals
- The area of the region enclosed between the curve y=x|x|, x -axis, x=-2 and x=2 is:2025
- Find the area of the region bounded by the lines y=4 x+5, x+y=5 and 4 y=x+5, using integration.2023
- Roundabouts are often made on busy roads to ease the traffic and avoid red lights. One such round-about is made such that equation representing its…2026
- Using integration, find the area of the smaller region enclosed by the curve 4 x^2+4 y^2=9 and the line 2 x+2 y=3. OR If the area of the region…2022
- Sketch the curve described by {(x, y): 9 x^2+16 y^2=144} and find the area of the region enclosed by it, using integration.2026
- Find the area of the region bounded by the lines x-2 y=4, x=-1, x=6 and x -axis, using integration.2024
- Using integration, find the area of the region bounded by y=m x( m>0), x=1, x=2 and the x -axis.2023
- Find the area of the region bounded by curve 4 x^2=y and the line y=8 x+12, using integration.2022
CBSE Class 12 Mathematics past-paper question from the 2025 board exam, with the answer as CBSE’s own marking scheme gives it. Where our answers come from.