SolveIt is under development
SolveItNCERT · CBSE · NEET

NCERT Exemplar · Class 10 Mathematics Statistics and Probability

96 questions · 96 still being checked

EXERCISE 13.4 1–10 (part 10 of 11)

  1. Exercise 1

    Find the mean marks of students for the following distribution.
    MarksNumber of students
    0\displaystyle 0 and above80\displaystyle 80
    10\displaystyle 10 and above77\displaystyle 77
    20\displaystyle 20 and above72\displaystyle 72
    30\displaystyle 30 and above65\displaystyle 65
    40\displaystyle 40 and above55\displaystyle 55
    50\displaystyle 50 and above43\displaystyle 43
    60\displaystyle 60 and above28\displaystyle 28
    70\displaystyle 70 and above16\displaystyle 16
    80\displaystyle 80 and above10\displaystyle 10
    90\displaystyle 90 and above8\displaystyle 8
    100\displaystyle 100 and above0\displaystyle 0

    Matches the book, not yet reviewed

    This working reaches the answer NCERT prints. It has not yet been read through by hand.

    NCERT’s answer
    51.$\displaystyle 75$
    Convert the cumulative (\(\displaystyle \ge\)) table to class frequencies by successive subtraction, then apply the step-deviation method with \(\displaystyle a=45,\ h=10\).\[f_i:\ 3,5,7,10,12,15,12,6,2,8 \quad \Sigma f_i = 80 \] \[\bar{x} = a + h\cdot\frac{\Sigma f_i d_i}{\Sigma f_i} \] \[\Sigma f_i d_i = 54 \] \[\bar{x} = 45 + 10\cdot\frac{54}{80} = 51.75 \]Answer: Mean marks \(\displaystyle = 51.75 \).
  2. Exercise 2

    [Find the mean of the following distribution.]
    MarksNumber of students
    Below 10\displaystyle 105\displaystyle 5
    Below 20\displaystyle 209\displaystyle 9
    Below 30\displaystyle 3017\displaystyle 17
    Below 40\displaystyle 4029\displaystyle 29
    Below 50\displaystyle 5045\displaystyle 45
    Below 60\displaystyle 6060\displaystyle 60
    Below 70\displaystyle 7070\displaystyle 70
    Below 80\displaystyle 8078\displaystyle 78
    Below 90\displaystyle 9083\displaystyle 83
    Below 100\displaystyle 10085\displaystyle 85

    Matches the book, not yet reviewed

    This working reaches the answer NCERT prints. It has not yet been read through by hand.

    NCERT’s answer
    48.$\displaystyle 41$
    The table is a less-than cumulative distribution; convert it to class frequencies by successive subtraction, then find the mean by the step-deviation method with \(\displaystyle a=45,\ h=10\).\[f_i:\ 5,4,8,12,16,15,10,8,5,2 \quad \Sigma f_i = 85 \] \[\bar{x} = a + h\cdot\frac{\Sigma f_i d_i}{\Sigma f_i} \] \[\Sigma f_i d_i = 29 \] \[\bar{x} = 45 + 10\cdot\frac{29}{85} = 48.41 \]Answer: Mean marks \(\displaystyle \approx 48.41\).
  3. Exercise 3

    Find the mean age of 100\displaystyle 100 residents of a town from the following data.
    Age equal and above (in years)0\displaystyle 010\displaystyle 1020\displaystyle 2030\displaystyle 3040\displaystyle 4050\displaystyle 5060\displaystyle 6070\displaystyle 70
    Number of persons100\displaystyle 10090\displaystyle 9075\displaystyle 7550\displaystyle 5025\displaystyle 2515\displaystyle 155\displaystyle 50\displaystyle 0

    Matches the book, not yet reviewed

    This working reaches the answer NCERT prints. It has not yet been read through by hand.

    NCERT’s answer
    $\displaystyle 31$ years
    Convert the \(\displaystyle \ge\) cumulative table to class frequencies, then apply the step-deviation method with \(\displaystyle a=35,\ h=10\).\[f_i:\ 10,15,25,25,10,10,5 \quad \Sigma f_i = 100 \] \[\bar{x} = a + h\cdot\frac{\Sigma f_i d_i}{\Sigma f_i} \] \[\Sigma f_i d_i = -40 \] \[\bar{x} = 35 + 10\cdot\frac{-40}{100} = 31 \]Answer: Mean age \(\displaystyle = 31\) years.
  4. Exercise 4

    The weights of tea in 70\displaystyle 70 packets are shown in the following table
    Weight (in g)Number of packets
    200\displaystyle 200-201\displaystyle 20113\displaystyle 13
    201\displaystyle 201-202\displaystyle 20227\displaystyle 27
    202\displaystyle 202-203\displaystyle 20318\displaystyle 18
    203\displaystyle 203-204\displaystyle 20410\displaystyle 10
    204\displaystyle 204-205\displaystyle 2051\displaystyle 1
    205\displaystyle 205-206\displaystyle 2061\displaystyle 1
    Find the mean weight of packets.

    Matches the book, not yet reviewed

    This working reaches the answer NCERT prints. It has not yet been read through by hand.

    NCERT’s answer
    201.$\displaystyle 96$ g
    Apply the step-deviation method with \(\displaystyle a=202.5,\ h=1\), the midpoint of the third class.\[f_i:\ 13,27,18,10,1,1 \quad \Sigma f_i = 70 \] \[\bar{x} = a + h\cdot\frac{\Sigma f_i d_i}{\Sigma f_i} \] \[\Sigma f_i d_i = -38 \] \[\bar{x} = 202.5 + 1\cdot\frac{-38}{70} = 201.96 \]Answer: Mean weight \(\displaystyle \approx 201.96\) g.
  5. Exercise 5

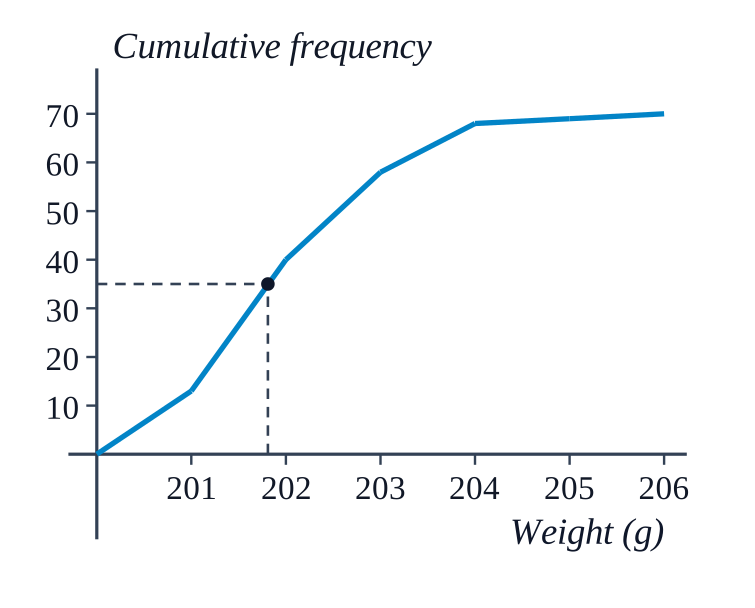
    Refer to Q.4 above. Draw the less than type ogive for this data and use it to find the median weight.

    Not cross-checked

    NCERT prints no numerical answer for this exercise, so this working has not been cross-checked against the book.

    Plot the less-than ogive using upper class boundaries against cumulative frequency.\[(201,13),\ (202,40),\ (203,58),\ (204,68),\ (205,69),\ (206,70) \]NCERT_Solution_Class10_Maths_Exemplar_Ch13_Ex13-4_Q5\[\frac{N}{2} = \frac{70}{2} = 35 \] The horizontal line at \(\displaystyle y=35\) meets the curve in the class \(\displaystyle 201\text{--}202\); by the median formula, \[\text{Median} = l + \frac{\dfrac{N}{2}-cf}{f}\times h = 201 + \frac{35-13}{27}\times 1 = 201.81 \]Answer: Median weight \(\displaystyle \approx 201.81\) g.
  6. Exercise 6

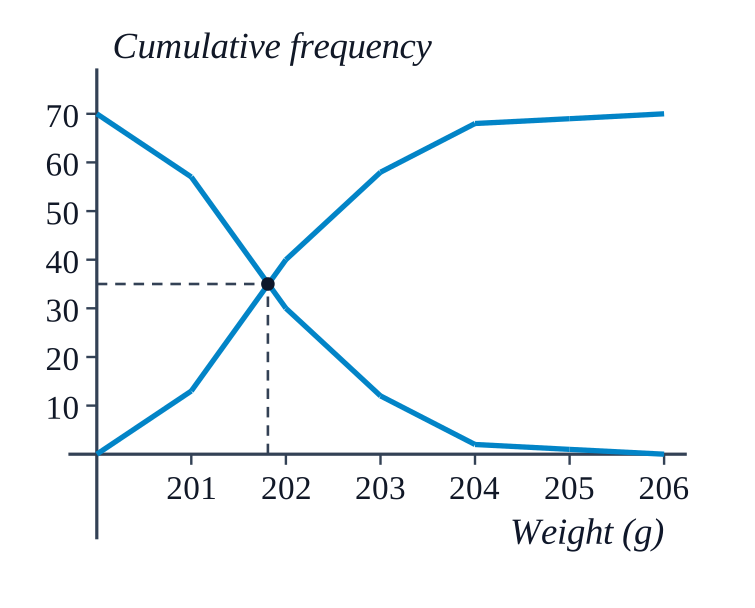
    Refer to Q.5 above. Draw the less than type and more than type ogives for the data and use them to find the median weight.

    Not cross-checked

    NCERT prints no numerical answer for this exercise, so this working has not been cross-checked against the book.

    Plot the less-than ogive of Q.5 together with the more-than ogive, whose cumulative frequencies are \(\displaystyle 70 - cf\); their intersection gives the median directly.\[\text{less-than: } (201,13),(202,40),(203,58),(204,68),(205,69),(206,70) \] \[\text{more-than: } (200,70),(201,57),(202,30),(203,12),(204,2),(205,1) \]NCERT_Solution_Class10_Maths_Exemplar_Ch13_Ex13-4_Q6Both chords lie over \(\displaystyle 201\text{--}202\); equating them, \[13+27(x-201) = 57-27(x-201) \] \[54(x-201) = 44 \implies x = 201+\frac{22}{27} = 201.81 \]Answer: Median weight \(\displaystyle \approx 201.81\) g.
  7. Exercise 7

    The table below shows the salaries of 280\displaystyle 280 persons.
    Salary (in ₹ thousand)Number of persons
    5\displaystyle 5-10\displaystyle 1049\displaystyle 49
    10\displaystyle 10-15\displaystyle 15133\displaystyle 133
    15\displaystyle 15-20\displaystyle 2063\displaystyle 63
    20\displaystyle 20-25\displaystyle 2515\displaystyle 15
    25\displaystyle 25-30\displaystyle 306\displaystyle 6
    30\displaystyle 30-35\displaystyle 357\displaystyle 7
    35\displaystyle 35-40\displaystyle 404\displaystyle 4
    40\displaystyle 40-45\displaystyle 452\displaystyle 2
    45\displaystyle 45-50\displaystyle 501\displaystyle 1
    Calculate the median and mode of the data.

    Matches the book, not yet reviewed

    This working reaches the answer NCERT prints. It has not yet been read through by hand.

    NCERT’s answer
    Median salary = Rs $\displaystyle 13420$, Modal salary = Rs $\displaystyle 12730$
    Cumulative frequencies place the median in class \(\displaystyle 10\text{--}15\) (\(\displaystyle cf=49,\ f=133\)); the same class, having the highest frequency, is also the modal class.\[N = 280,\quad \frac{N}{2} = 140 \] \[\text{Median} = l+\frac{\dfrac{N}{2}-cf}{f}\times h = 10+\frac{140-49}{133}\times 5 = 13.42 \] \[\text{Mode} = l+\frac{f_1-f_0}{2f_1-f_0-f_2}\times h = 10+\frac{133-49}{2(133)-49-63}\times 5 = 12.73 \]Answer: Median ≈ ₹$\displaystyle 13.42$ thousand; Mode ≈ ₹$\displaystyle 12.73$ thousand.
  8. Exercise 8

    The mean of the following frequency distribution is 50\displaystyle 50 but the frequencies f1\displaystyle f_1 and f2\displaystyle f_2 in classes 20\displaystyle 20-40\displaystyle 40 and 60\displaystyle 60-80\displaystyle 80, respectively are not known. Find these frequencies, if the sum of all the frequencies is 120.
    Class0\displaystyle 0-20\displaystyle 2020\displaystyle 20-40\displaystyle 4040\displaystyle 40-60\displaystyle 6060\displaystyle 60-80\displaystyle 8080\displaystyle 80-100\displaystyle 100
    Frequency17\displaystyle 17f1\displaystyle f_132\displaystyle 32f2\displaystyle f_219\displaystyle 19

    Matches the book, not yet reviewed

    This working reaches the answer NCERT prints. It has not yet been read through by hand.

    NCERT’s answer
    \(\displaystyle f_1=28, f_2=24\)
    \[17+f_1+32+f_2+19=120 \] \[f_1+f_2=52 \] Midpoints $\displaystyle 10$, $\displaystyle 30$, $\displaystyle 50$, $\displaystyle 70$, 90. \[\Sigma f_ix_i=170+30f_1+1600+70f_2+1710=3480+30f_1+70f_2 \] \[\bar{x}=\dfrac{\Sigma f_ix_i}{\Sigma f_i}=50\ \Rightarrow\ 3480+30f_1+70f_2=6000 \] \[3f_1+7f_2=252 \] Substitute \(\displaystyle f_1=52-f_2\): \[3(52-f_2)+7f_2=252 \] \[156+4f_2=252 \] \[f_2=24,\quad f_1=28 \] Answer: \(\displaystyle f_1=28,\ f_2=24\).
  9. Exercise 9

    The median of the following data is 50. Find the values of p\displaystyle p and q\displaystyle q, if the sum of all the frequencies is 90.
    MarksFrequency
    20\displaystyle 20-30\displaystyle 30p\displaystyle p
    30\displaystyle 30-40\displaystyle 4015\displaystyle 15
    40\displaystyle 40-50\displaystyle 5025\displaystyle 25
    50\displaystyle 50-60\displaystyle 6020\displaystyle 20
    60\displaystyle 60-70\displaystyle 70q\displaystyle q
    70\displaystyle 70-80\displaystyle 808\displaystyle 8
    80\displaystyle 80-90\displaystyle 9010\displaystyle 10

    Matches the book, not yet reviewed

    This working reaches the answer NCERT prints. It has not yet been read through by hand.

    NCERT’s answer
    \(\displaystyle p=5, q=7\)
    \[p+15+25+20+q+8+10=90 \] \[p+q=12 \] \[\dfrac{N}{2}=\dfrac{90}{2}=45 \] Median \(\displaystyle 50\) lies in class $\displaystyle 50$-$\displaystyle 60$: \(\displaystyle l=50,\ f=20,\ h=10,\ cf=p+40\). \[50=50+\dfrac{45-(p+40)}{20}\times10 \] \[0=\dfrac{5-p}{2}\ \Rightarrow\ p=5 \] \[q=12-p=7 \] Answer: \(\displaystyle p=5,\ q=7\).
  10. Exercise 10

    The distribution of heights (in cm) of 96\displaystyle 96 children is given below
    Height (in cm)Number of children
    124\displaystyle 124-128\displaystyle 1285\displaystyle 5
    128\displaystyle 128-132\displaystyle 1328\displaystyle 8
    132\displaystyle 132-136\displaystyle 13617\displaystyle 17
    136\displaystyle 136-140\displaystyle 14024\displaystyle 24
    140\displaystyle 140-144\displaystyle 14416\displaystyle 16
    144\displaystyle 144-148\displaystyle 14812\displaystyle 12
    148\displaystyle 148-152\displaystyle 1526\displaystyle 6
    152\displaystyle 152-156\displaystyle 1564\displaystyle 4
    156\displaystyle 156-160\displaystyle 1603\displaystyle 3
    160\displaystyle 160-164\displaystyle 1641\displaystyle 1
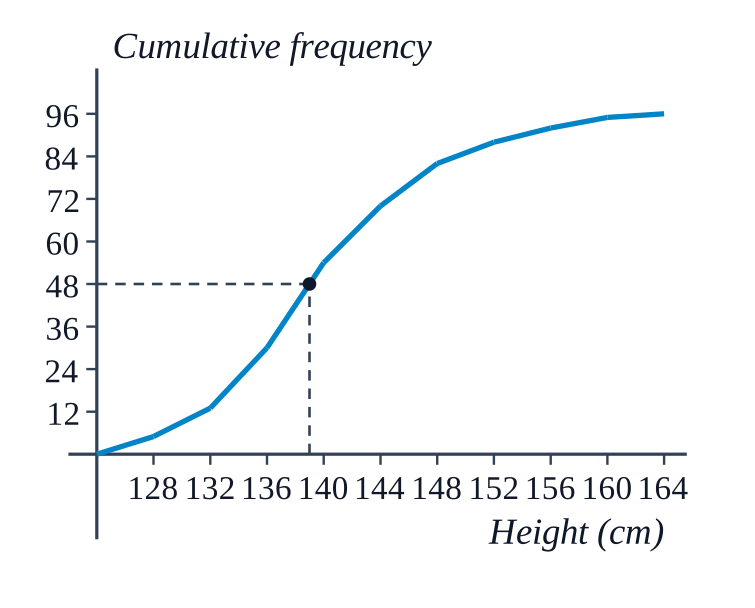
    Draw a less than type cumulative frequency curve for this data and use it to compute median height of the children.

    Not cross-checked

    NCERT prints no numerical answer for this exercise, so this working has not been cross-checked against the book.

    Less than type: \(\displaystyle 124\!:\!0,\ 128\!:\!5,\ 132\!:\!13,\ 136\!:\!30,\ 140\!:\!54,\ 144\!:\!70,\ 148\!:\!82,\ 152\!:\!88,\ 156\!:\!92,\ 160\!:\!95,\ 164\!:\!96\). NCERT_Solution_Class10_Maths_Exemplar_Ch13_Ex13-4_Q10 \[N=96,\quad \dfrac{N}{2}=48 \] Curve meets \(\displaystyle y=48\) near \(\displaystyle x=139\). Median class $\displaystyle 136$-$\displaystyle 140$: \(\displaystyle l=136,\ cf=30,\ f=24,\ h=4\). \[\text{Median}=136+\left(\dfrac{48-30}{24}\right)4=136+3=139 \] Answer: Median height \(\displaystyle =139\) cm.