✓ Board-verified
Physics · 2025 · 1 mark
CBSE 2025 · Region 2 · Set 3 · Q8
The alternating current I in an inductor is observed to vary with time t as shown in the graph for a cycle. Which one of the following graphs is the…
The alternating current $\displaystyle I$ in an inductor is observed to vary with time $\displaystyle t$ as shown in the graph for a cycle.
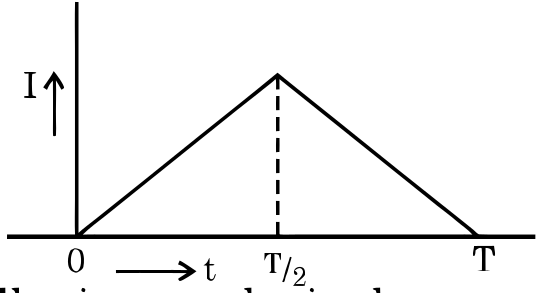 Which one of the following graphs is the correct representation of wave form of voltage $\displaystyle V$ with time $\displaystyle t$?
Which one of the following graphs is the correct representation of wave form of voltage $\displaystyle V$ with time $\displaystyle t$?Official answer
(C)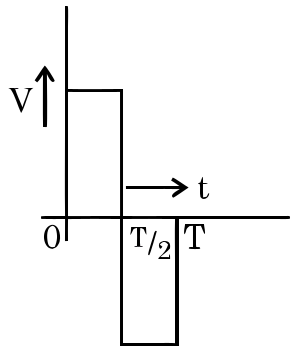
All Alternating Current questions2025 question paperNCERT solutions: Alternating CurrentPractice Alternating Current →
More from Alternating Current
- Distinguish between reactance and impedance of an ac circuit. Show that an ideal inductor in an ac circuit does not dissipate any power.2024
- An alternating current is given by I=I_0 cos (100 π) t. The least time the current takes to decrease from its maximum value to zero will be:2025
- A resistor of 30 Ω and a capacitor of 250/(π) μ F are connected in series to a 200 V, 50 Hz ac source. Calculate (i) the current in the circuit, and…2023
- A resistor and an ideal inductor are connected in series to a 100 √2 V, 50 Hz ac source. When a voltmeter is connected across the resistor or the…2024
- A transformer is connected to a 200 V ac source. The transformer supplies 3000 V to a device. If the number of turns in the primary coil is 450, then…2025
- An alternating current I=14 sin (100 π t) A passes through a series combination of a resistor of 30 Ω and an inductor of (2/(5 π)) H. Taking √2=1.4,…2023
- Which of the following statements about a series LCR circuit connected to an ac source is correct?2023
- An inductor, a capacitor and a resistor are connected in series across an ac source of voltage. If the frequency of the source is decreased…2023
CBSE Class 12 Physics past-paper question from the 2025 board exam, with the answer as CBSE’s own marking scheme gives it. Where our answers come from.