✓ Board-verified
Biology · 2022 · 2 marks
CBSE 2022 · Region 4 · Set 1 · Q6
(a) The graphs given below, A and B, represent population of elephants in two different National Parks (a hypothetical situation) at different times.…
The graphs given below, A and B, represent population of elephants in two different National Parks (a hypothetical situation) at different times.
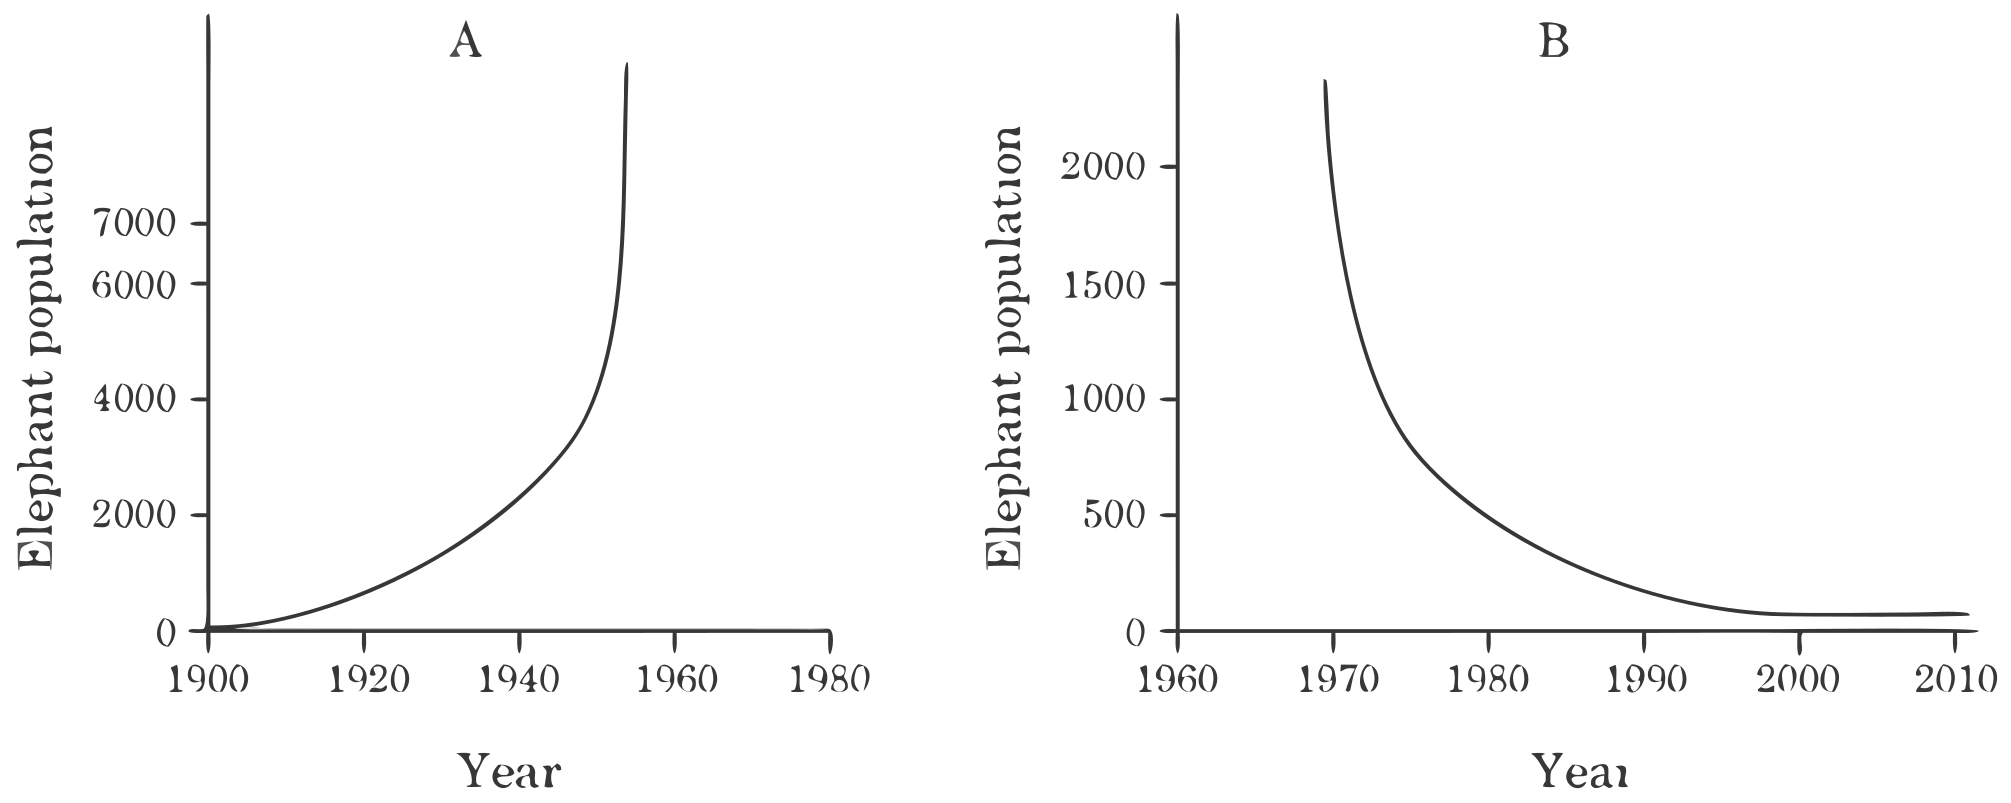
Study the graphs and comment upon the pattern of growth observed. Mention the possible reason for such patterns seen in nature.
As per a recent newspaper report, a particular country showed declining population growth rate. According to you, what could be the two most possible reasons for this decline and why ?
Marking-scheme solution
(a) • Graph A depicts exponential growth/ geometric growth, due to unlimited resources and absence of checks/ environmental resistances
Graph B shows extinction, due to lack of resources and environmental resistances.
Possible Reasons for decline in human population : Increased Emigration, Increased Mortality, Decreased Birth Rate / Natality, Use of contraceptives, spread of epidemic
//
Possible reasons for decline in plants, animals / other organisms' population: Deforestation, Decreased food availability, Predation pressure, adverse weather, competition
All Organisms and Populations questions2022 question paperNCERT solutions: Organisms and PopulationsPractice Organisms and Populations →
More from Organisms and Populations
- Study the given graphs (X) and (Y) depicting the annual variation in solar radiation on Earth from January to December and answer the undermentioned…2022
- Assertion: Cattle and goats are never seen browsing on Calotropis growing in abandoned fields. Reason (R): Cattle and goats avoid grazing on…2023
- Interaction between clown fish living among the stinging tentacles of sea anemone is an example of -2023
- Why are predators considered to be 'prudent' in nature? Explain.2022
- State two morphological attributes observed in the leaves of desert plants that enable them to survive in extreme conditions in the desert.2022
- (i) Describe the population growth curve applicable in a population of any species in nature that has limited resources at its disposal. (ii) Give…2025
- Read the following passage and answer the questions that follow: In nature, we rarely find isolated, single individuals of any species; majority of…2025
- (i) Describe the Species-Area relationship as observed by Alexander von Humboldt, for a wide variety of taxa in nature. (ii) Draw the graph showing…2025
CBSE Class 12 Biology past-paper question from the 2022 board exam, with the answer as CBSE’s own marking scheme gives it. Where our answers come from.