✓ Board-verified
Biology · 2025 · 3 marks
CBSE 2025 · Region 2 · Set 3 · Q28
Study the pie chart given below, representing the global biodiversity and proportionate number of species of major taxa. Answer the following…
Study the pie chart given below, representing the global biodiversity and proportionate number of species of major taxa.
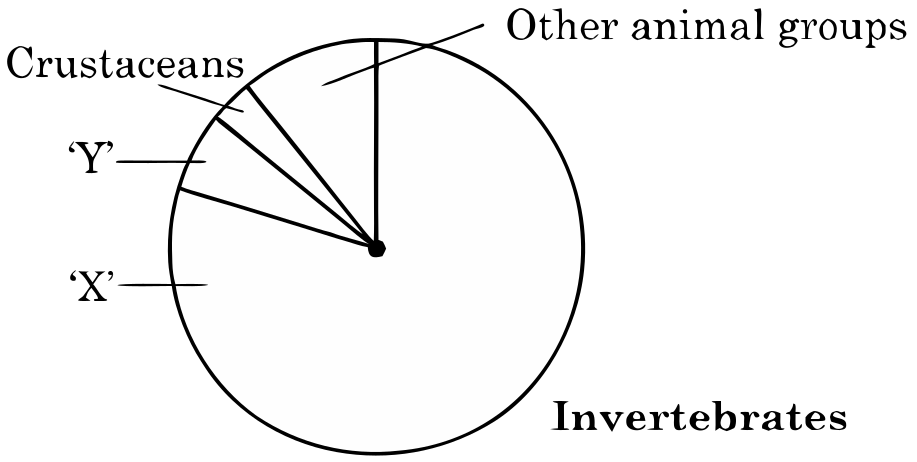
Answer the following questions :
(a)
Identify 'X' and 'Y' in the given pie chart.
(b)
Which one of the two 'X' or 'Y', is the most species-rich taxonomic group and by what percentage ?
(c)
Name the level of Biodiversity represented by the following :
(i)
Estuaries and alpine meadows in India
(ii)
The medicinal plant Rauwolfia vomitoria.
Marking-scheme solution
(a)
-‘x’ is Insects
-‘y’ is Molluscs
(b)
-‘x’ is most species rich taxonomic group
-more than $\displaystyle 70$% of the total animals.
(c)(i)
Ecological diversity
(ii)
Genetic diversity
All Biodiversity and Conservation questions2025 question paperNCERT solutions: Biodiversity and ConservationPractice Biodiversity and Conservation →
More from Biodiversity and Conservation
- Enlist two criteria that are used to identify a region for maximum protection as 'Biodiversity hotspots'. Name any two "hotspot" regions in our…2022
- Exploration of molecular, genetic and species level diversity for gaining products of economic importance is called2026
- Given below is an equation describing the Species-Area relationship between species richness and area for a wide variety of taxa as angiosperm…2022
- How are 'in-situ' and 'ex-situ' approaches of biodiversity conservations different from each other?2022
- Given below is a pie chart representing global diversity of vertebrates. Redraw the pie chart identifying the groups 'A', 'B', 'C' and 'D' in their…2024
- According to a recent wildlife report, the biggest threat to the tiger's survival in Mudumalai Tiger Reserve (MTR) was found to be a small, beautiful…2025
- India has only 2.4% of the world's land area but its share of the global species diversity is:2025
- "Abingdon tortoise in Galapagos islands became extinct within a decade on introduction of goats in the island." Explain giving reason.2023
CBSE Class 12 Biology past-paper question from the 2025 board exam, with the answer as CBSE’s own marking scheme gives it. Where our answers come from.